Make sense of what just doesn't make sense, by doing things like growing GRASS...

Submitted by Norm Roulet on Sat, 05/01/2010 - 15:05.

ICEarth Bigbang computers, our Linux distro, and our optimal open source data and application configurations are designed to handle the most processor (CPU and GPU), memory and transaction intensive challenges in the world, to save Earth. Doing that requires an integration of our regional and global geographic information systems with layers of valuable insight not yet integrated, like environmental, atmospheric and topographic data, to drive analyses of life impacting factors in our neighborhoods like environmental fallout from all sources of pollution, to the home and child, for free to them. A good explanation of the type of data and analyses included in such capabilities is described below, helping you make sense of what just doesn't make sense, by doing things like growing GRASS...


Wind Rose

Vista Data Vision has 3 different Wind Roses to analyze Wind Direction Data: Basic Wind Rose, Vector Wind Rose and Filter Wind Rose.

Wind Rose is a clever way of analyzing data that is related to wind direction. Not only is Wind Rose perfect to plot the classical Wind Rose, e.g. wind speed against wind direction, but actually any sensor against wind direction. As an example, check where from the precipitation is coming, or air temperature or air humidity, or where from the ambient pollution is coming from, like Dust, NO, NOx, SO2, H2O etc.

How does it work?

  1. On a page with Wind Direction, click on its graph to enlarge it.
  2. On the top menu bar, choose any of the 3 Wind Rose options.
  3. Choose filter variable, choose time period.
  4. That's it! And its works both on the VDV web interface as on the db.data browser desktop software.

Wind Rose Basic
The Wind Rose diagram showing the wind distribution for a specific time period.

Advanced Wind Rose 1, Vector Wind Rose
Vector Wind Rose for Wind Speed
Vector Wind Rose plot for Air Temperature.

The Vector Windrose allows you to view the distribution of a second Variable in connection to Wind Direction.

Vector Wind Rose Setup
Customize presentation for different Units. Choose the limit for each segment as well as the color. Choose the number of Bins and labeling options.

Vector Wind Rose for Rain
Vector Wind Rose for Rain. Notice that 86% of the data is not shown since it is below 0.1 mm.

Vector Wind Rose PM10
Vector Wind Rose for Dust in PM10 units (Environmental measurement).

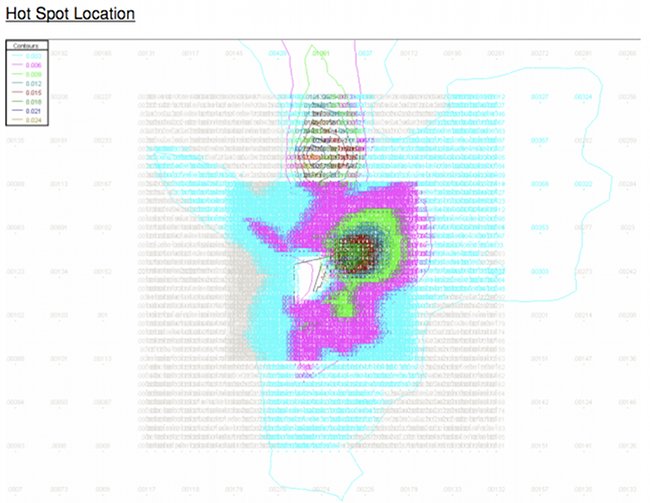
NOTE - THESE ILLUSTRATIONS ARE FROM VISTA DATA VISION - I have not used their products so this is not an endorsement - good explanation and visuals - they are found here.