Certain regions bear a greater responsibility for producing GHG emissions - The United States Midwest is one such region!
Submitted by Norm Roulet on Sat, 04/09/2011 - 14:47.
I had the good fortune to attend the first World's Fair held in Japan - Expo '70(日本万国博覧会,Nihon bankoku hakuran-kai). The theme was "Progress and Harmony for Mankind" and one of the main principles of the master plan was that the wisdom of all the peoples of the world would come together in this place and stimulate ideas. The Expo featured demonstrations of early mobile phones, local area networking and maglev train technology. At age 9, I rode Bullet Trains 100 miles an hour and thought the world could be no more modern than "modern" Japan, of 1970.
At the same time I was exposed to the modern power, wisdom and vision of all the world-peoples' progress and harmony at 日本万国博覧会, in Osaka... 福島第一原子力発電所 was being born, in Okuma, representing the ultimate in "power"-wisdom and vision of that nuclear age. The Fukushima I Nuclear Power Plant was connected to the grid around 40 years ago, in 1970, and the world hasn't really evolved our "power"-wisdom beyond that now-ancient "modern" time... as our 1970s "modern" energy technology and world are melting-down.
The Fukushima I Nuclear Power Plant(福島第一原子力発電所,Fukushima Dai-Ichi Genshiryoku Hatsudensho, Fukushima I NPP), often referred to as Fukushima Dai-ichi (Dai-ichi simply means first or number 1), is a nuclear power plant located in the town of Okuma in the Futaba District of Fukushima Prefecture, Japan, first commissioned in 1971. The plant consists of six boiling water reactors. These light water reactors have a combined power of 4.7 GW, making Fukushima I one of the 25 largest nuclear power stations in the world. Fukushima I was the first nuclear plant to be constructed and run entirely by the Tokyo Electric Power Company (TEPCO). The plant suffered major damage from the 8.9 earthquake and subsequent tsunami that hit Japan on March 11, 2011, disabling the reactor cooling systems and triggering a widespread evacuation surrounding the plant.
Unit 1 is a 460 MW boiling water reactor (BWR-3) constructed in July 1967. It commenced commercial electrical production on March 26, 1971, and was initially scheduled for shutdown in early 2011. In February 2011, Japanese regulators granted an extension of ten years for the continued operation of the reactor.
At the same time Fukushima I was being powered up in Okuma, a now-equally-out-of-date nuclear power plant began construction in Ohio:
Davis-Besse Nuclear Power Station is a nuclear power plant with a single pressurized water reactor, also referred to as a light water reactor. As of 2006[update], it is operated by the FirstEnergy Nuclear Operating Company subsidiary of FirstEnergy Corp. The power station is located on the southwest shore of Lake Erie about 10 miles (16 km) north of Oak Harbor, Ohio. It is the 57th commercial power reactor to commence building in the United States of America (construction began on September 1, 1970) and the 50th to come on-line July 31, 1978.
According to the Nuclear Regulatory Commission, Davis-Besse has been the source of two of the top five most dangerous nuclear incidents in the United States since 1979.
On September 24, 1977, the reactor, running at only 9% power, shut down because of a disruption in the feedwater system. This caused the relief valve for the pressurizer to stick open. As of 2005, the NRC considers this to be the fourth highest ranked safety incident
On June 9, 1985, the main feedwater pumps, used to supply water to the reactor steam generators, shut down. A control room operator then attempted to start the auxiliary (emergency) feedwater pumps. These pumps both tripped on overspeed conditions because of operator error. This incident was originally classified an "unusual event" (the lowest classification the NRC uses) but it was later determined that it should have been classified a "site area emergency".
On June 24, 1998 the station was struck by an F2 tornado. The plant's switchyard was damaged and access to external power was disabled. The plant's reactor automatically shut down at 8:43 pm and an alert (the next to lowest of four levels of severity) was declared at 9:18 pm. The plant's emergency diesel generators powered critical facility safety systems until external power could be restored.
If a Pacific Ocean Tsunami may take a 40-year-old nuclear plant to meltdown conditions in Japan, today, and an F2 tornado took 20-year-old Davis-Besse off grid and down to generator back-up, in 1998, imagine what a Category F4 or F5 tornado along Lake Erie could do to that isolated 33-year-old nuclear plant in Ohio, this Summer...
The 1924 Lorain-Sandusky was a deadly tornado which struck the towns of Sandusky and Lorain, Ohio on June 28, 1924. At least 85 people were killed by the tornado, with others killed by tornadoes that struck the northern and eastern half of the state. It is the deadliest single tornado and tornado outbreak ever in Ohio history, killing more people than the more famous 1974 Xenia Tornado (F5) during the Super Outbreak and the 1985 United States-Canadian tornado outbreak respectively.
Damage amounts was estimated at $1 billion (1997 dollars) which ranks it 10th costliest ever. While the Fujita scale was not existent at the time, the damage was estimated to be at around F4.
There are still some uncertainties on whether the Sandusky-Lorain tornado was a single tornado event due to the 25-mile path of the storm across Lake Erie between Sandusky and Lorain, however many eyewitnesses showed a single severe storm crossing the Lake before coming on-shore again just after 5:00 PM.
Davis-Besse is located on the southwest shore of Lake Erie, near Sandusky... in an area that is also "No Stranger to Quakes"... near active earthquake epicenters, as was a critical factor in the failure of Fukushima I:
Earthquakes, although common in some parts of the world, can strike anywhere including Ohio. The images in Haiti are hard to forget. Lives were taken, families were torn apart, and the city of Port-au-Prince was destroyed.
Ohio Seismic expert Michael Hansen said it could happen here.
"Oh definitely so," he said. "We often wonder if we could generate a 6 or 6.5 in Ohio."
The worst earthquake to hit the state was in 1937, when a 5.4 struck Anna, now considered the earthquake capital of the state.
Anna is just southwest of Sandusky, and Davis-Besse.
What are the odds of that next 1-in-1,000-year "perfect storm" - that seems to be happening somewhere in the world every few months, these days - next hitting some old Nuclear facility in Ohio. That would be no more odd than that is happening in Northeast Japan.
It is easy to criticize Japanese regulators, the operators of this facility and the nuclear power generation sector today, when several nuclear reactors at the stricken Fukushima Daiichi plant in northeastern Japan may have ruptured and are releasing radioactive material, meaning six nuclear reactors are in states of extreme crises. Several workers from these plants are confirmed dead and many are injured - 100s of workers and other people in the area have clearly been exposed to excessive radiation - and the death toll is just beginning. After 40 years of operation without serious environmental incident, one of the worst natural disasters in recorded history has brought this entire complex and the entire nuclear industry worldwide to the state of melt-down.
Now, as the people of the world get serious about the risk of aging nuclear powerplants melting down in Okuma, and their backyards, they must get serious about the harm caused the world by all power generation, in their backyards, and realize that our US power generation portfolio has not been innovated or evolved significantly since the days of Expo 70, when innovation brought the wisdom of all the peoples of the world together to stimulate ideas about things like power, while taking the world nuclear.
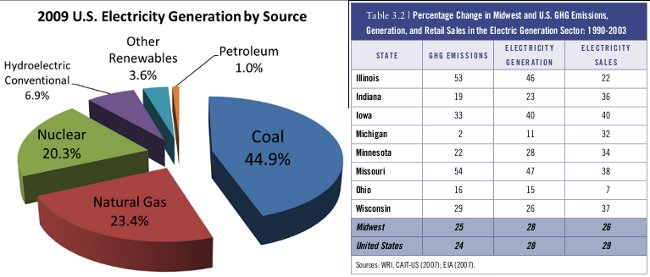
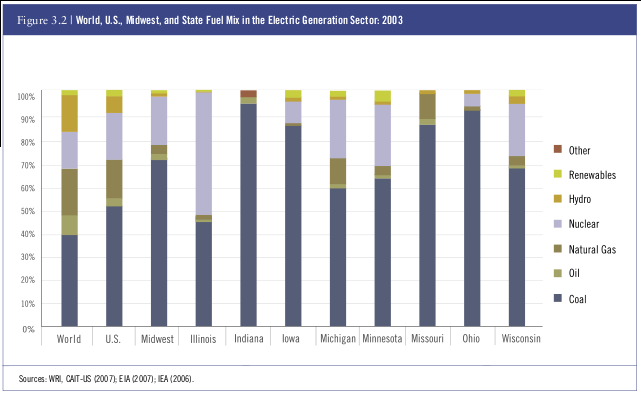
Over 20% of U.S. electricity generation - over 20% of electirc generation in the Midwest - over half in Illinois - comes from nuclear reactors. Old nuclear reactors, like in Japan!
If Japan - the world - America - the Midwest - Northeast Ohio didn't generate 20% or so of our electricity from nuclear power - if we hadn't had that cleaner-than-coal power source the last four decades - and instead used the only real alternatives to nuclear for electricity generation we clever baby-boomed greatest-generation super-human-beings really bothered to develop in our long-fossilized, wasteful consumerist lives - highly polluting and ecologically destructive coal, natural gas and oil - we would have emitted so much more life-killing, climate changing pollution into our environment that I'm sure far more people than the population of Japan would have died over the past four decades as a result, all over the world... including 1,000,000s of people in Ohio
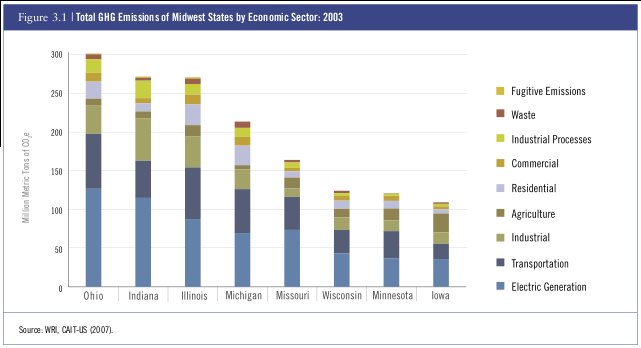
From the Executive Summary of CHARTING THE MIDWEST - An Inventory and Analysis of Greenhouse Gas Emissions in America’s Heartland, from October, 2007: "With total GHG emissions of 299 million metric tons of CO2e, Ohio is the largest emitting state in the Midwest and fourth largest nationally. This is principally due to the size of Ohio’s population and economy, and its reliance on coal-fired electricity production."
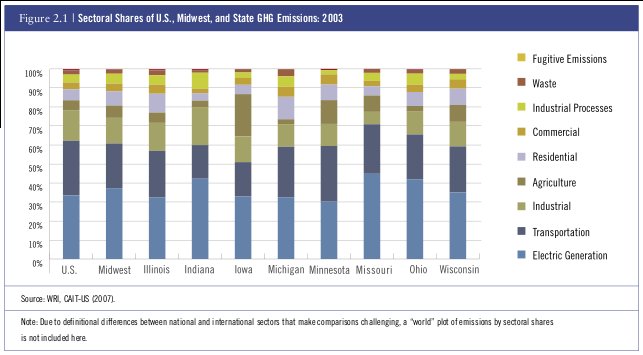
KEY REGIONAL FINDINGS: The Midwest is a major emitter of GHG emissions in national and international terms. With GHG emissions of approximately 1.5 billion metric tons of carbon dioxide equivalent (CO2e) in 2003, the eight Midwest states examined in this report account for nearly 25 percent of total U.S. emissions and 5 percent of world emissions. If the Midwest were its own country, it would be the fifth largest emitter in the world. All eight Midwest states rank in the top 25 nationally for GHG emissions, with four states—Ohio, Indiana, Illinois, and Michigan—ranking in the top 10.
Three sectors—electric generation, transportation, and industrial energy use—account for 75 percent of total Midwest GHG emissions. With average annual respective growth rates of 1.7 and 1.4 percent, the top two emitting sectors—electric generation and transportation—are also the fastest-growing sectors in the Midwest. Total emissions from these sectors are increasing slightly faster in the Midwest than they are nationally.
GHGs (including CO2, CH4, and N2O) do occur naturally, trapping heat essential to maintaining Earth’s habitability. However, increasing GHG concentrations are exacerbating the natural greenhouse effect, warming the planet, and causing significant changes to the global climate system. Over the past century, the global mean temperature rose by approximately 0.7°C (1.3°F), and in recent decades the observed rate of warming has accelerated (IPCC, 2007). The effects of this temperature increase on our planet’s climate are already apparent: global sea level is rising, mountain glaciers and polar ice are receding, and changes in precipitation patterns are intensifying storms, as well as floods and droughts (see Levin and Pershing, 2007, and references therein).
Future climate change will most likely continue to create environmental, economic, and sociopolitical uncertainties.
The challenge of climate change is undeniably daunting.
However, although the problem of climate change is fundamentally global in scope, certain countries and regions bear a greater responsibility for producing GHG emissions. Consequently, their participation in GHG-reduction solutions is critical to reducing worldwide emissions and requires an aggressive shift away from “business as usual” to less GHG-intensive practices. The United States Midwest is one such region.
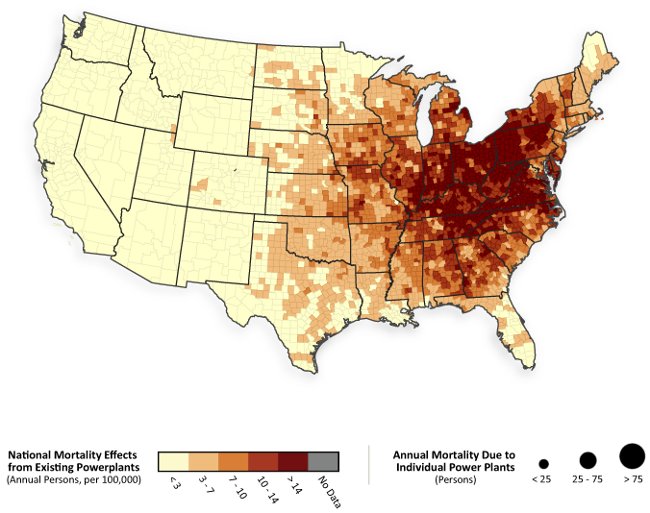
The chart above shows citizens of Northeast Ohio have the worst level of mortality from coal fired power plants in America - based on an online risk assessment tool accompanying the September 2010 Clean Air Taskforce study The Toll From Coal - An Updated Assessment of Death and Disease from America’s Dirtiest Energy Source. As the introduction states: "Among all industrial sources of air pollution, none poses greater risks to human health and the environment than coal-fired power plants – perhaps most consequential of all from a public health standpoint – fine particle pollution."
Fine particles are especially dangerous because they can bypass the body’s defensive mechanisms and become lodged deep in the human lung. Indeed, research also indicates that short-term exposures to fine particle pollution is linked to cardiac effects, including increased risk of heart attack. Meanwhile, long-term exposure to fine particle pollution has been shown to increase the risk of death from cardiac and respiratory diseases and lung cancer, resulting in shorter life-expectancy for people living in the most polluted cities compared to people who live in cleaner cities. And although research suggests fine particles reduce the average life span of the general population by a few years, the life of an individual dying as a result of exposure to air pollution may be shortened by 14 years.
The hopeful news for Northeast Ohio in this science is:
Because most fine particle-related deaths are thought to occur within a year or two of exposure, reducing power plant pollution will have almost immediate benefits.
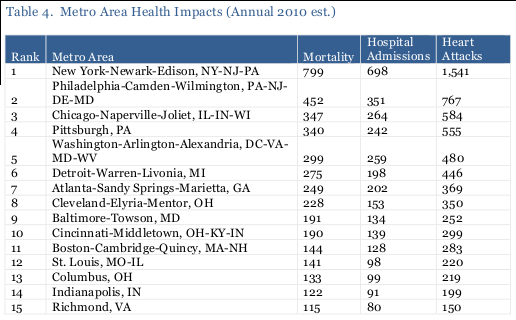
The worst news is, considering the greatest harm to human health comes from fine particle pollution, and Northeast Ohio has many more sources of fine particle pollution than just the 500 major coal power plants considered in the data of this study (think Mittal), it is an understatement to say the air pollution situation in Northeast Ohio is far worse than it appears in this Clean Air Taskforce report, and there Ohio is ranked the second-worst America gets... and the Cleveland-area is the 8th most toxic metropolitan area in the county...
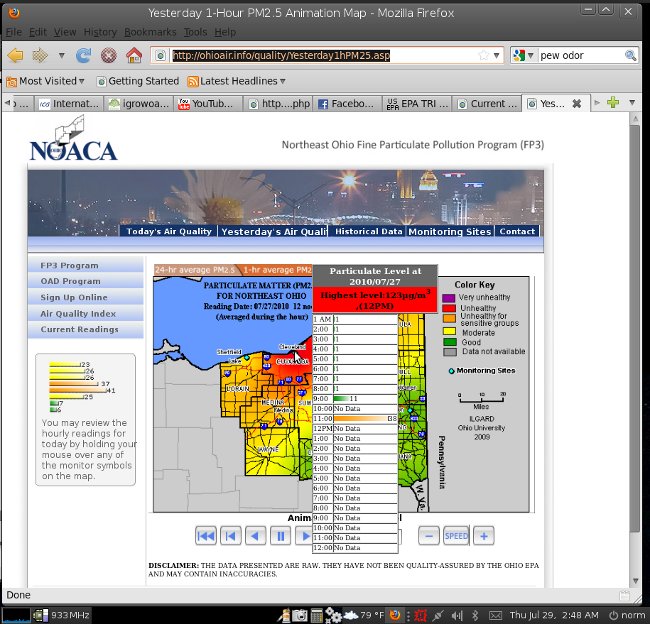
Excessive Particulate Air Pollution in Cleveland, Ohio, is largely caused by Areclor/Mittal steel mill. While EPA
air quality monitoring equipment is always defective, results regularly show VERY unsafe air pollution levels here.
But the Clean Air Taskforce study doesn't include projections of harm from smaller coal fired power plants and industrial boilers here, like MCCO and Cleveland Thermal, nor from the Arcelor/Mittal combination steel mill in downtown Cleveland - which is by far the most toxic point source in our region... and far worse in ways than coal power plants - nor the toxins from over 160 other hazardous point sources in the EPA Toxic Release Inventory data for Cuyahoga County - not to mention the point sources in the other highly-developed, surrounding, contaminating counties... and transportation related pollution from our heavily traveled roads, airports, rails and waterways...
So, you soon realize, the Best Location in the Nation is by far the least fitting name for Cleveland imaginable - the most toxic location in the nation is more accurate.
The only good news for Northeast Ohio, in any of this, is that we have nuclear plants to generate 20% of our electricity in the region, to reduce by 20% the harm from other more deadly pollution point sources, like coal power plants.
Thank God for our Nuclear fleet in America's Mid-west!
CHARTING THE MIDWEST
An Inventory and Analysis of Greenhouse Gas Emissions in America’s Heartland
JOHN LARSEN THOMAS DAMASSA RYAN LEVINSON
October, 2007
Confronted with global climate change—a challenge of enormous scope and complexity—
and a failure of national leadership in addressing the challenge, leaders in state government
have taken it upon themselves to act in the best interest of their citizens. Seventeen states
are moving to cap emissions, and twenty-five more have developed programs to increase
the use of renewable energy. The states that are leading in these efforts have rapidly
discovered the importance of having comprehensive information on the nature and
sources of GHG emissions and the complexities of the economic and technical forces that
drive emissions growth.
Charting the Midwest provides an in-depth study of GHG emissions for the states of the
U.S. Midwest—one of the most economically diverse regions of the country—at a critical
early stage. Because there is no single path for the Midwest to follow toward realizing a
low-carbon future, a rigorous up-front assessment of emission sources, trends, and drivers
is essential. With this information, Illinois, Indiana, Iowa, Michigan, Missouri, Minnesota,
Ohio, and Wisconsin now have an important tool necessary to design state and regional
priorities appropriate to their circumstances.
We present, for the first time, GHG emission profiles that allow comparison of the various
classes of GHGs across all sectors of the economy at both a state and a regional level. Our
goal is to provide analysis that helps the Midwest states to address the climate change crisis
in their individual and collective actions. Additionally, with this transparent accounting of
GHG emissions, the Midwest states join others in opening their books to federal legislators
in an effort to move forward a national climate change dialogue.
Charting the Midwest comes at a critical juncture. The science is in, and the G8 has explicitly
elevated climate change as a global priority. And, now—for the first time—the United States
Congress has promised to make climate change a national priority.
The Midwest states have an opportunity to play a climate leadership role that helps to shape
the ongoing national debate, and, in doing so, to develop new technologies, create jobs, and
build an economic base that is environmentally sustainable.
J O N AT H A N L A S H
President, World Resources Institute
Washington, D.C.


