What made the Ozone levels around Brewster so unhealthy last night?
Submitted by Norm Roulet on Mon, 06/26/2006 - 04:54.
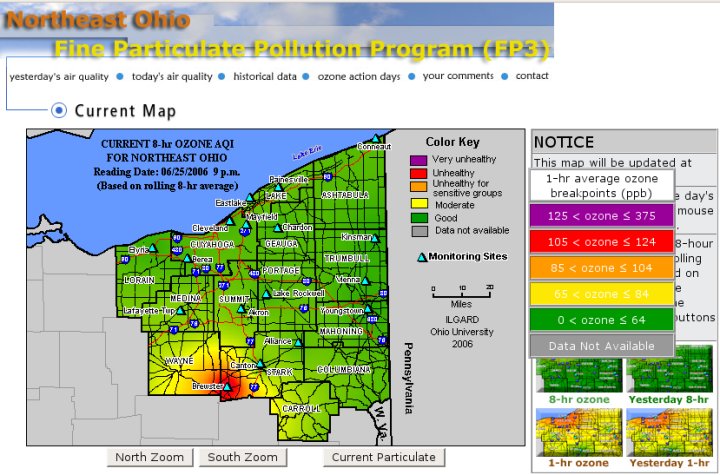
As I've come to realize the people of NEO have no warning how dangerous is our environment, I make a point to check out the Ozone readings online at NOACA frequently, and I'm always suprised by the odd findings... like last night, when most of NEO was safe, there was suddenly enough Ozone around Brewster, Ohio, to throw the 8-hour rolling average to unsafe - meaning there were some real nasty peak readings, and something is very wrong in that part of the region. So what gives - I've never heard of Brewster before - anyone have a clue what would cause such wild increases in Ozone in the middle of nowhere, in the middle of the night?
|


Pollution and polluters around Ohio and USA
Now we're getting somewhere on this pollution mess in NEO... there is an infromative site with pollution scorecards from 2002 for all over America, including Stark County, Ohio, where Brewster and Canton are located... see the scorecard here, where you can also look up your community and feel really sick... but first consider what the people of Brewster's bodies deal with day-in and day-out... clearly worse some days than other:
Your Zip Code: 44613 Your Community: STARK County
What Are the Major Pollutants?
Reported Environmental Releases from TRI Sources in 2002
Rank Chemical Name Pounds
1 XYLENE (MIXED ISOMERS) 116,994
2 STYRENE 68,490
3 DICHLOROMETHANE 56,557
4 GLYCOL ETHERS 52,449
5 TOLUENE 35,941
6 SEC-BUTYL ALCOHOL 29,172
7 AMMONIA 28,268
8 N-BUTYL ALCOHOL 26,180
9 ZINC 23,159
10 ETHYLBENZENE 17,951
11 MANGANESE 17,786
12 PROPYLENE 16,264
13 ZINC COMPOUNDS 15,524
14 N-HEXANE 15,067
15 BENZENE 11,579
16 ETHYLENE 7,419
17 TRICHLOROETHYLENE 5,247
18 1,2,4-TRIMETHYLBENZENE 4,968
19 NITRIC ACID 3,025
20 CHROMIUM 2,357
Your Zip Code: 44613
Your Community: STARK County
Who Is Polluting Your Community?
Reported Environmental Releases from TRI Sources in 2002
Rank Facility City Pounds
1 REPUBLIC STORAGE SYS. CO. INC. CANTON 187,293
2 MARATHON ASHLAND PETROLEUM OHIO REFINING DIV. CANTON 106,150
3 SANCAP LINER TECH. ALLIANCE 43,800
4 U.S. FIBERGLASS PRODS. INC. MIDDLEBRANCH 37,360
5 TIMKEN CO. HARRISON STEEL PLANT CANTON 24,759
6 A.R.E. INC. MASSILLON 24,131
7 REPUBLIC ENGINEERED PRODS. L.L.C. CANTON FACILITY CANTON 20,707
8 MIDWEST TANK SERVICES INC. CANTON 18,415
9 NORTH AMERICAN MOLDED PRODS. HARTVILLE 15,046
10 CROWN CORK & SEAL CO. (USA) INC. MASSILLON 14,500
11 STAR BRONZE CO. INC. ALLIANCE 13,239
12 SUGARDALE FOODS INC. CANTON 11,894
13 TIMKEN CO. - FAIRCREST STEEL PLANT CANTON 7,376
14 PCC AIRFOILS L.L.C. MINERVA 6,241
15 SUPERIOR DAIRY CANTON 6,200
16 REPUBLIC TECHS. INTL. MASSILLON HRB MASSILLON 5,407
17 U.S. CHEMICAL & PLASTICS INC. MASSILLON 4,844
18 KEPHACO CORP. (DBA AMERICAN MARBLE INDS.) CANTON 4,813
19 HOOVER CO. PLANT 1 NORTH CANTON 4,642
20 J & L SPECIALTY STEEL L.L.C. LOUISVILLE 2,933
For those back in Cuyahoga County and worried about lead...
* Hot Spots of Lead Air Quality Hazards
Counties in OHIO with the Highest Ambient Air Concentrations of Lead:
Rank County ug/m3
1. CUYAHOGA .36
2. FULTON .27
3. LOGAN .2
4. COLUMBIANA .04
5. FRANKLIN .02
Counties in OHIO with the Greatest Reported Releases of Lead to Air:
Rank County Pounds
1. CUYAHOGA 4,585
2. LORAIN 2,732
3. MARION 1,547
4. SCIOTO 1,493
5. ASHLAND 1,319
Counties in OHIO with the Greatest Reported Releases of Lead Compounds to Air:
Rank County Pounds
1. CUYAHOGA 22,720
2. BUTLER 2,915
3. PICKAWAY 2,437
4. MIAMI 1,710
5. COLUMBIANA 1,686
Rank counties in OHIO by reported releases of lead or lead compounds to air
Major Chemical Releases or Waste Generation in CUYAHOGA County
From SCORECARD.GOV, the pollution information site... at least the Federal Government is looking out for the people of NEO... not that it is doing us any good!
See how this county ranks on other chemical release and waste management attributes tracked by Scorecard
Rank counties in OHIO or facilities in CUYAHOGA County by chemical releases or waste generation
*Note: These rankings are based on chemical releases and transfers reported by industrial facilities to the Toxics Release Inventory, and do not take into account major sources of pollution or toxic chemicals that are not covered by TRI.