SearchUser loginOffice of CitizenRest in Peace,
Who's new
Subscribe |
Welcome to BP’s Energy Outlook 2030 - "it is a wake-up call, not something any of us would like to see happening"Submitted by Norm Roulet on Sat, 01/22/2011 - 14:48.
On the January 27, 2011 YouTube Ask The President moderated broadcast, Obama was asked who was his favorite person in math and science. Obama said one of the things he loves about being President is "having access to math and science" and the White House is committed to using technology well. "Serious brainpower out there." He highlighted his PCAST team and its Director Eric Lander - says he helps make complex science understandable. From MIT - "President-elect Barack Obama on Friday named Eric Lander, the founding director of the Broad Institute, a co-chair of the President's Council of Advisors on Science and Technology (PCAST), a group that assists the president in making science and technology policy decisions".
BP Energy Outlook 2030 - London, January 2011
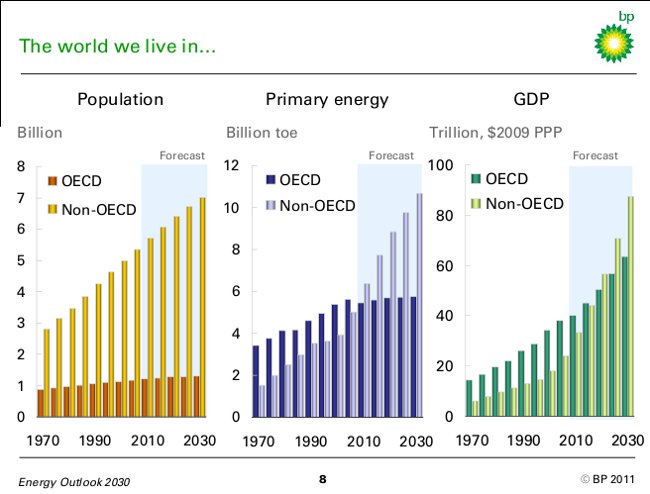
The world we live in...
...is poised for further growth Population and income growth are the two most powerful driving forces behind the demand for energy. Since 1900 world population has more than quadrupled, real income has grown by a factor of 25, and primary energy consumption by a factor of 22.5. The next 20 years are likely to see continued global integration, and rapid growth of low and medium income economies. Population growth is trending down, but income growth is trending up. Over the last 20 years world population has increased by 1.6 billion people, and it is projected to rise by 1.4 billion over the next 20 years. The world’s real income has risen by 87% over the past 20 years and it is likely to rise by 100% over the next 20 years. At the global level, the most fundamental relationship in energy economics remains robust – more people with more income means that the production and consumption of energy will rise.
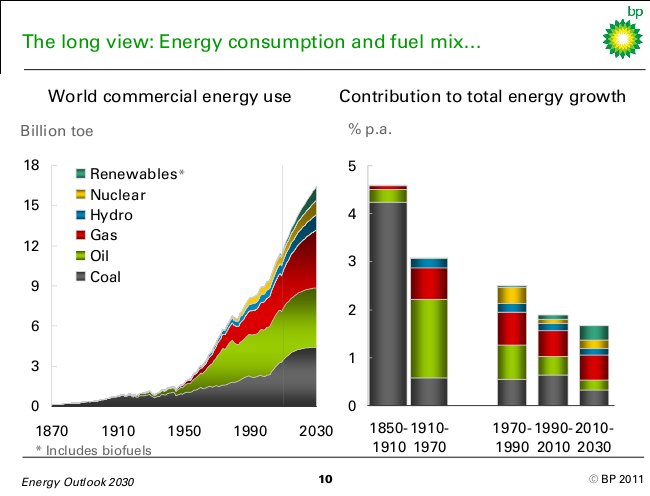
The long view: Energy consumption and fuel mix...
...mirror technology and economic development Powerful long run trends continue to shape the modern energy economy: industrialisation, urbanisation and motorisation. These trends are associated with
The first great wave of industrialisation was based almost entirely on a truly disruptive technology, the steam engine, and on coal. Coal remained the dominant fuel until after WWII. The next major transition came with electricity and the internal combustion engine, which enabled diversification away from coal. Oil replaced coal use in transport. And while coal remains the principal fuel in power generation, it is gradually being replaced first by natural gas, and now by renewables.
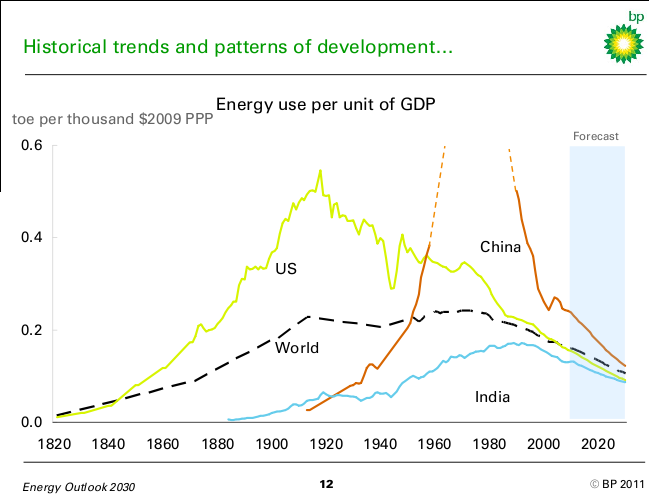
Historical trends and patterns of development...
...can help us understand how the future may unfold Today, the amount of energy used to produce a unit of GDP (“energy intensity”) is declining steadily in most countries. Historically, a common pattern emerges. Energy intensity
As one would expect, regional peak levels decline over time (as energy efficiency improves) and are higher in countries with abundant energy resources. Global competition and open markets drive convergence.
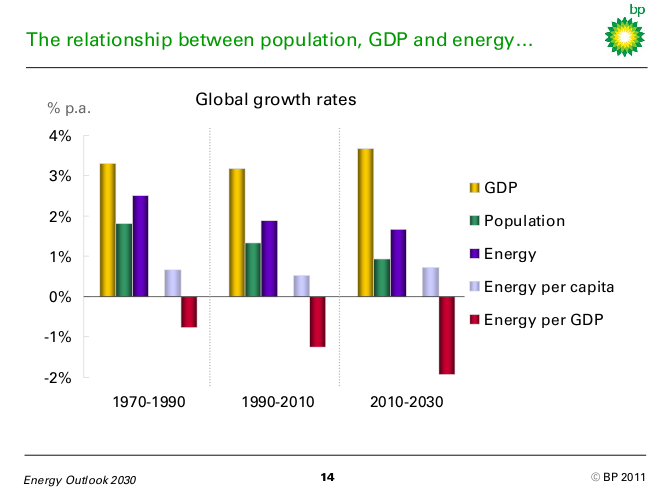
The relationship between population, GDP and energy...
...changes slowly, but it changes As globalisation proceeds, the next 20 years are likely to see rapid growth of low and medium income economies. Energy consumption per capita to 2030 is likely to grow at about the same rate as in 1970-90 (0.7% p.a.). But energy efficiency – measured very broadly as energy per unit of GDP – continues to improve globally, and at an accelerating rate. In 2010-30 this is true for the global average and for almost all of the key countries and regions. This acceleration is important. It restrains the overall growth of primary energy. Energy efficiency gains and a long-term structural shift away from industry and toward less energy intensive activities - first in rich and then in newly industrialised economies - underpins this trend. Prices, economic development (the rise and decline of the industrial sector) and energy policies (the promotion of energy efficiency) play important roles in changing technology and the energy required to support continued economic growth.
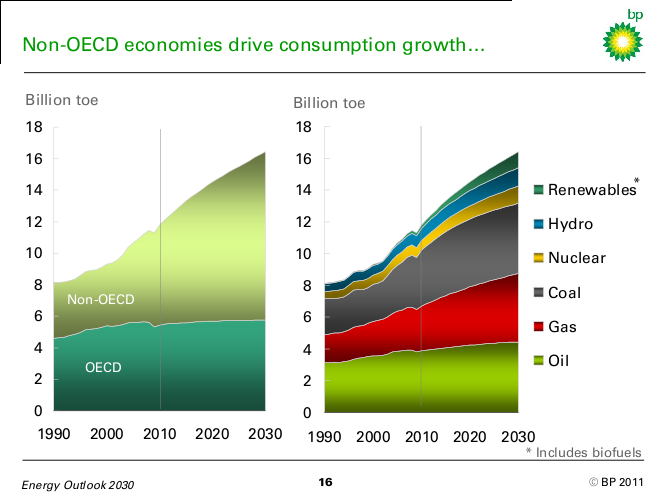
Non-OECD economies drive consumption growth...
...as the fuel mix gradually shifts away from oil and coal World primary energy consumption grew by 45% over the past 20 years, and is likely to grow by 39% over the next 20 years. Global energy consumption growth averages 1.7% p.a. from 2010 to 2030, with growth decelerating gently beyond 2020. Non-OECD energy consumption is 68% higher by 2030, averaging 2.6% p.a. growth from 2010, and accounts for 93% of global energy growth. OECD energy consumption in 2030 is just 6% higher than today, withgrowth averaging 0.3% p.a. to 2030. From 2020, OECD energy consumption per capita is on a declining trend (-0.2% p.a.). The fuel mix changes relatively slowly, due to long asset lifetimes, but gas and non-fossil fuels gain share at the expense of coal and oil. The fastest growing fuels are renewables (including biofuels) which are expected to grow at 8.2% p.a. 2010-30; among fossil fuels, gas grows the fastest (2.1% p.a.).
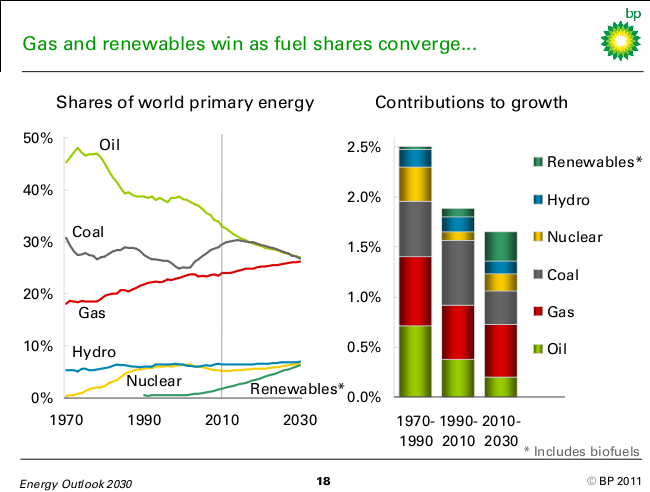
Gas and renewables win as fuel shares converge...
...and the energy supply mix diversifies The three fossil fuels are converging on market shares of 26-27%, and the major non-fossil fuel groups on market shares of around 7% each. Oil continues to suffer a long run decline in market share, while gas steadily gains. Coal’s recent gains in market share, on the back of rapid industrialisation in China and India, are reversed by 2030. The diversifying fuel mix can be seen most clearly in terms of contributions to growth. Over the period 1990-2010, fossil fuels contributed 83% of the growth in energy; over the next twenty years, fossil fuels contribute 64% of the growth. Taken together, the contribution of all non-fossil fuels to growth over the next twenty years (36%) is, for the first time, larger than that of any single fossil fuel. Renewables (including biofuels) account for 18% of the growth in energy to 2030. The rate at which renewables penetrate the global energy market is similar to the emergence of nuclear power in the 1970s and 1980s.
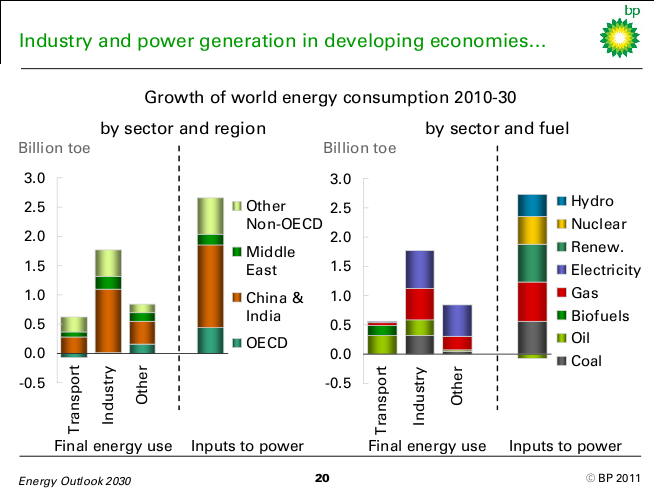
Industry and power generation in developing economies...
...dominate the growth of energy consumption In the OECD, energy consumption for transport is in decline and industrial use is likely to be flat; all the growth in energy end-use comes from the “other” sector (households and the service sector). In the non-OECD, industry drives the growth of final energy consumption, particularly in rapidly developing economies. Overall, energy used to generate power remains the fastest growing sector, accounting for 57% of the projected growth in primary energy consumption to 2030. The diversification of the fuel mix is being driven largely by the power sector, where non-fossil fuels, led by renewables, account for more than half of the growth. Gas accounts for more than half of the growth in fossil-fuelled power. In transport, we are starting to see diversification, driven by policy and enabled by technology, with biofuels accounting for nearly a third of energy demand growth.
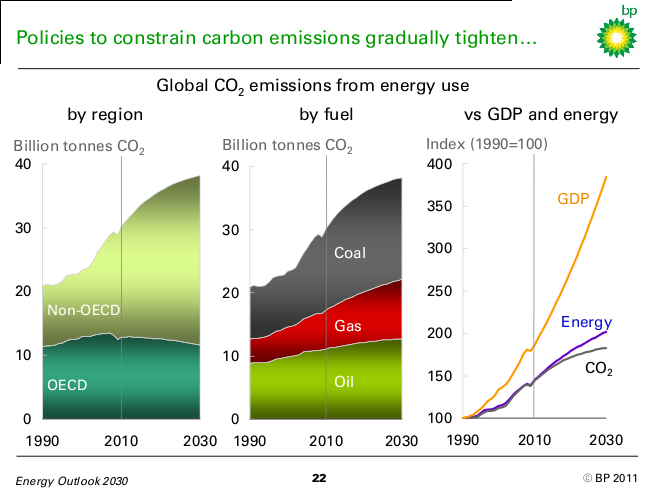
Policies to constrain carbon emissions gradually tighten...
...and have a significant impact on emissions growth by 2030 Strong growth in non-OECD energy consumption, especially of coal, translates into continued growth of global CO2 emissions. The growth of global CO2 emissions from energy averages 1.2% p.a over the next twenty years (compared to 1.9% p.a. 1990-2010), leaving emissions in 2030 27% higher than today. The implementation of carbon abatement policies in the OECD reduces the level of emissions in 2030, but only by 10% relative to current levels. Non-OECD emissions grow by 2.2% p.a. on average, up 53% by 2030. Policies in non-OECD countries focus on reducing the carbon intensity of economic growth. Carbon per unit of GDP falls by 42% by 2030, and the rate of decline accelerates steadily. By 2020-30, non-OECD emissions are growing by only 1.3% p.a., compared to 5.2% p.a. growth over 2000-2010. Overall, this implies some progress towards climate change goals, but not enough to put the world on a path to stabilisation at 450 ppm.
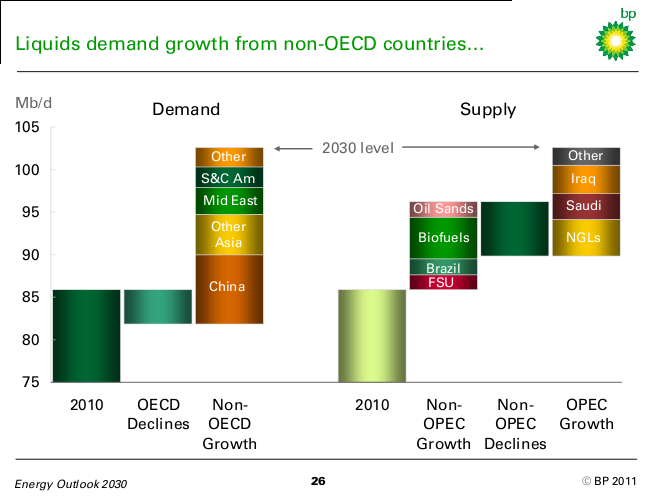
Oil (and other liquid fuels) Liquids demand growth from non-OECD countries...
...will be met by supply growth from OPEC and biofuels Oil is expected to be the slowest-growing fuel over the next 20 years. Global liquids demand (oil, biofuels, and other liquids) nonetheless is likely to rise by 16.5 Mb/d, exceeding 102 Mb/d by 2030. Growth comes exclusively from rapidly-growing non-OECD economies. Non-OECD Asia accounts for more than three-quarters of the net global increase, rising by nearly 13 Mb/d. The Middle East and South & Central America will also grow significantly. OECD demand has likely peaked (in 2005), and consumption is expected to decline by just over 4 Mb/d. Rising supply to meet expected demand growth should come primarily from OPEC, where output is projected to rise by 13 Mb/d. The largest increments of new OPEC supply will come from NGLs, as well as conventional crude in Iraq and Saudi Arabia. Non-OPEC supply will continue to rise, albeit modestly. A large increase in biofuels supply, along with smaller increments from Canadian oil sands, deepwater Brazil, and the FSU should offset continued declines in a number of mature provinces.
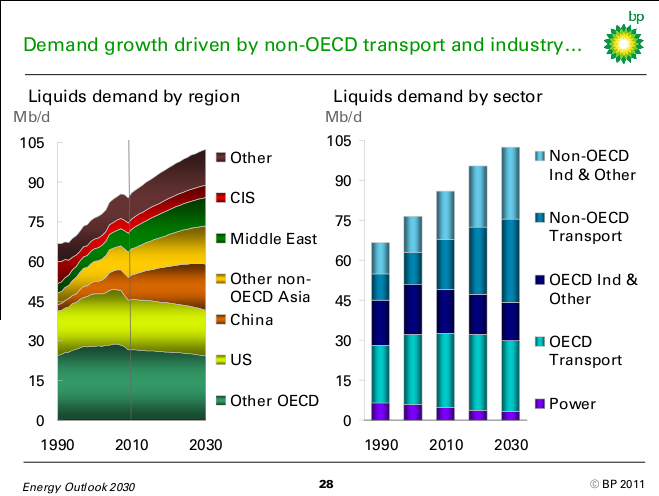
Demand growth driven by non-OECD transport and industry...
...while OECD demand falls across all sectors Global consumption growth in this outlook is projected to slow to 0.9% p.a. (from 1.3% in 1990-2010). OECD consumption will fall to 41.5 Mb/d, roughly the 1990 level. Non-OECD consumption is projected to overtake the OECD by 2015, and to approach 61 Mb/d by 2030 – more than double the 1990 level. However, excluding the FSU (where demand collapsed in the 90s) non-OECD growth is likely to be slower than 1990-2010 (2.2% vs 3.8% p.a.). By sector, liquids demand growth should come from non-OECD transport (nearly 13 Mb/d), with non-OECD industry also contributing (nearly 7 Mb/d, largely for petrochemicals). Expected OECD declines are concentrated outside the transport sector, in sectors where oil can be displaced by gas and renewables; post-2015, OECD transport demand is also expected to fall as technology and policy lead to improved engine efficiency. Overall consumption growth will be restrained by the increase in crude oil prices seen in recent years and by the continued, gradual reduction of subsidies in non-OECD countries.
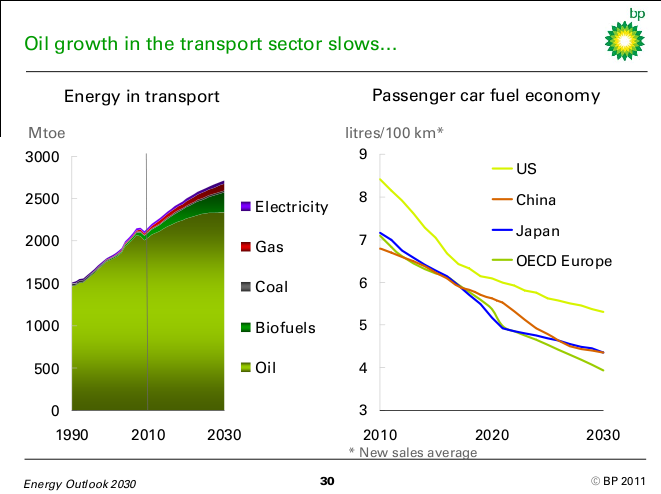
Oil growth in the transport sector slows...
...on displacement by biofuels and improved engine efficiency Energy used for transport will continue to be dominated by oil, but should see its share of global energy use decline as other sectors grow more rapidly. Growth is expected to slow over the next twenty years to average 1.1% p.a. vs 1.8% p.a. during 1990-2010, with OECD demand slowing and then declining post-2015. The slowing of growth in total energy in transport is related to higher oil prices and improving fuel economy, vehicle saturation in mature economies, and expected increases in taxation and subsidy reduction in developing economies. The growth of oil in transport slows even more dramatically, largely because of displacement of oil by biofuels and is likely to plateau in the mid-2020s. Currently, biofuels contribute 3% on an energy basis and this is forecast to rise to 9% at the expense of oil’s share. Rail, electric vehicles and plug-in hybrids, and the use of compressed natural gas in transport is likely to grow, but without making a material contribution to total transport before 2030.
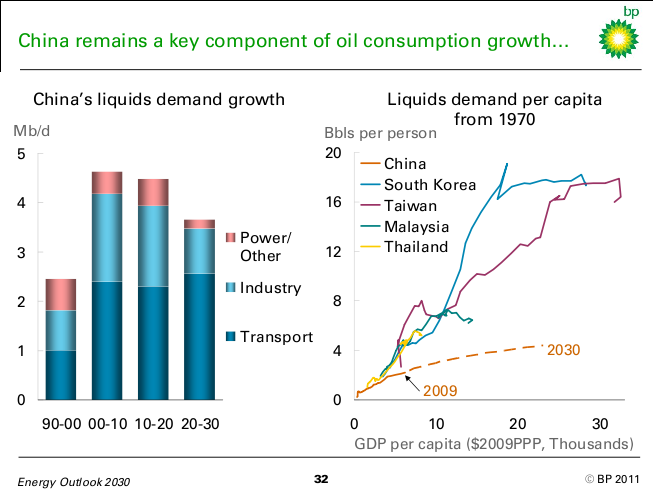
China remains a key component of oil consumption growth...
...but growth is likely to slow China is the largest source of oil consumption growth in our outlook, with consumption forecast to grow by 8 Mb/d to reach 17.5 Mb/d by 2030, overtaking the US to become the world’s largest oil consumer. Growth is expected to remain concentrated in the industrial and transport sectors through 2020. Industrial growth slows post-2020 as industrial expansion becomes less energy-intensive and population growth slows; transport will then be the dominant growth driver. Despite contributing almost half of net global oil consumption growth to 2030, our outlook projects a slower increase in per capita consumption than seen historically in other Asian economies. China is much less dependent on oil in its overall fuel mix (c. 20%) than many other emerging economies at similar points in their development. In addition, China is likely to implement policies to slow oil consumption growth - such as increasing taxes on transport fuels and maximising use of other fuels. Oil prices are higher than faced historically by other emerging economies; rising import dependence is a policy concern.
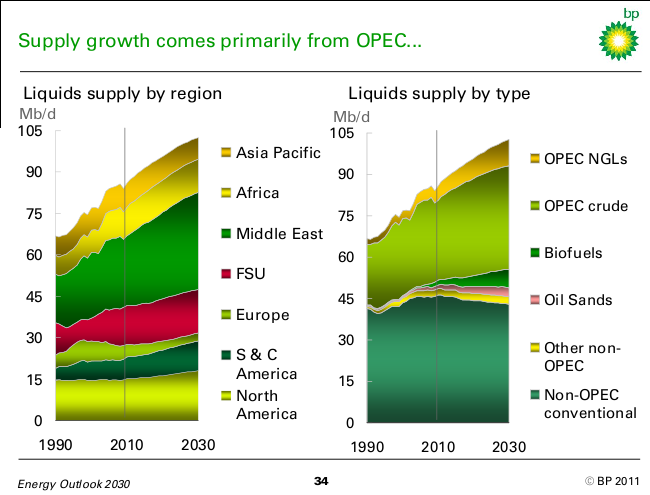
Supply growth comes primarily from OPEC...
...as unconventional liquids cause modest non-OPEC growth Globally, liquids production is expected to increase to meet the growth in consumption, though the sources of growth will change the global balance. Global liquids supply is set to rise by about 16.5 Mb/d by 2030. OPEC accounts for over 75% of global supply growth, with OPEC NGLs expected to grow by more than 4 Mb/d - driven in part by rapid growth of natural gas production. Iraqi crude output is projected to grow from about 2.5 Mb/d currently to more than 5.5 Mb/d; Saudi output is likely to expand by nearly 3 Mb/d. Non-OPEC output will rise by nearly 4 Mb/d. Unconventional supply growth should more than offset declining conventional output, with biofuels adding nearly 5 Mb/d and oil sands rising by nearly 2 Mb/d. Declining conventional crude supply in Europe, Asia Pacific and North America is partly offset by growth in deepwater Brazil and the FSU, resulting in a net decline of just over 3 Mb/d. In this outlook, Russia and Saudi Arabia will each sustain their current market share of roughly 12% over the next 20 years.
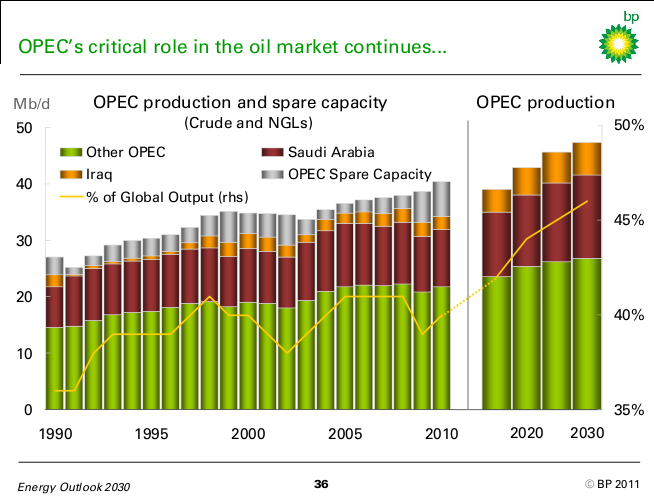
OPEC’s critical role in the oil market continues...
...with capacity expansion essential to meet demand growth The importance of OPEC is expected to grow. On our projections, OPEC’s share of global production would increase from 40% in 2010 to 46% in 2030 (a level not reached since 1977). In the early years of the outlook, OPEC production growth can be met by utilizing current spare capacity. Over time, capacity must expand to meet expected demand growth. In addition to NGL growth, we project an increase in crude oil production capacity of nearly 5 Mb/d by 2030 – to nearly 40 Mb/d – largely in Iraq and Saudi Arabia. These projections imply that Saudi production capacity, currently at 12.5 Mb/d, is likely to be sufficient to meet demand and maintain a reasonable buffer of spare capacity until around 2020; thereafter a modest expansion appears likely. While we do not attempt to forecast long-term energy prices, the ability and willingness of OPEC members to expand capacity and production clearly is one of the main factors determining the path of the oil market.
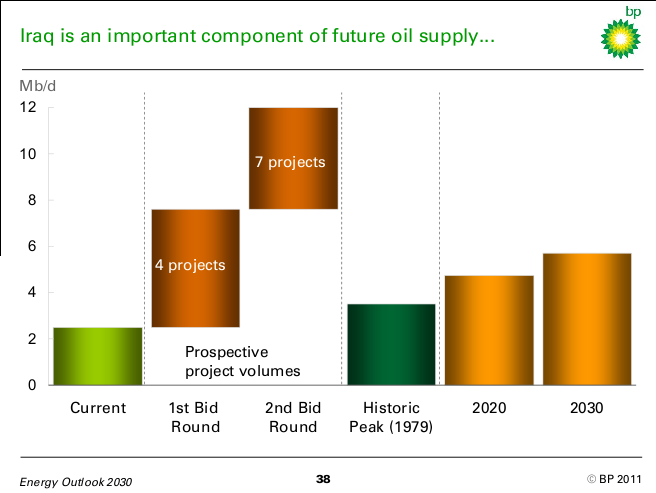
Iraq is an important component of future oil supply...
...and a major source of uncertainty The pace of Iraqi capacity expansion – and production growth – is a key source of uncertainty for this outlook. Iraq is expected to account for 20% of global supply growth from 2010 to 2030. Service contracts awarded since mid-2009 have signaled the notional (contractual) possibility that Iraqi capacity could reach 12 Mb/d by 2020. However, limited project development capacity and infrastructure constraints may result in project delays and cost inflation. Key challenges exist in developing export pipelines, terminals and water injection infrastructure. Security challenges, as well as political constraints, are also likely to weigh on capacity expansion plans. A rapid increase in Iraqi output could have an impact on oil prices. OPEC is likely over time to seek to reintegrate Iraq into the quota system, which is an additional source of uncertainty. While substantial capacity growth is likely, a number of factors should constrain the pace of expansion. Weighing these factors, we assume Iraqi production exceeds 4.5 Mb/d by 2020 and 5.5 Mb/d by 2030.
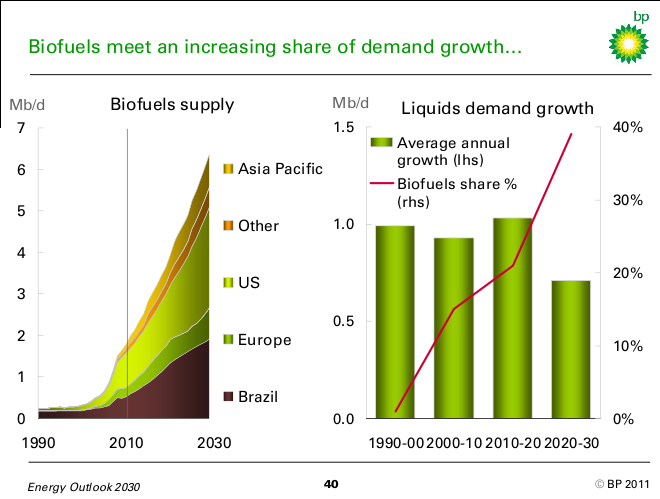
Biofuels meet an increasing share of demand growth...
...driven by supply expansion in the Western Hemisphere Biofuels production (largely ethanol) is expected to exceed 6.5 Mb/d by 2030, up from 1.8 Mb/d in 2010 – contributing 30% of global supply growth over the next 20 years, and all of the net growth in non-OPEC. Continued policy support, high oil prices in recent years, and technological innovations all contribute to the rapid expansion. The US and Brazil will continue to dominate production; together they account for 68% of total output in 2030 (from 76% in 2010). First-generation biofuels are expected to account for most of the growth. After 2020, roughly 40% of global liquids demand growth will be met by biofuels – up from 13% in 2010 – with the US and Europe leading consumption growth. By 2030, this figure approaches 60%.
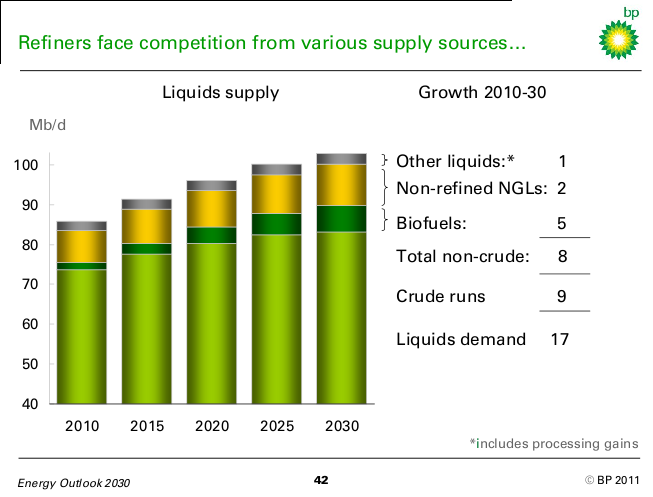
Refiners face competition from various supply sources...
...suggesting only modest growth in refinery throughput Growth in the call on refinery throughput will be impacted by the supply growth of biofuels (5 Mb/d) and non-refined NGLs (2 Mb/d). Increases in processing gains and growth in supplies of liquids derived from gas and coal are likely to add another 1 Mb/d to product supplies. All of these supply sources will compete directly with refineries to meet total liquids demand growth of 17 Mb/d, suggesting that the call on refinery throughput could grow by only 9 Mb/d over the next 20 years. Existing spare capacity will accommodate some of the future growth in refinery throughput. About half of global liquids demand growth is in China, and that country’s refinery expansion plans will affect product balances globally. A continuation of its strategy to be self-sufficient in refined products would severely curtail crude run increases for refiners outside of China.
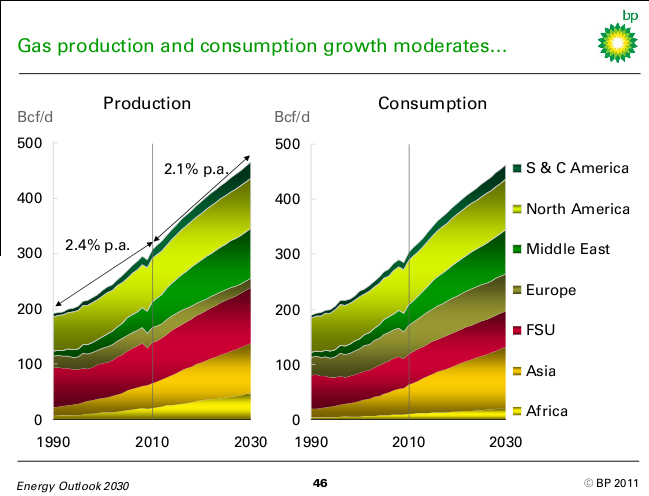
Gas production and consumption growth moderates...
...while shifting to emerging markets Natural gas is projected to be the fastest growing fossil fuel globally to 2030, but slows relative to historic patterns as the market base expands and demand-side efficiency measures gain hold. Production grows in every region except Europe, where decline rates at mature fields are likely to reverse the gains since 1975. Asia accounts for the world’s largest production and consumption increments. China drives 56% of the region’s consumption growth. The Middle East has the world’s second largest production and consumption increments. The region’s share in global consumption is expected to expand from 5% in 1990 and 12% in 2010 to 17% in 2030. Its share in global production grows from 15% in 2010 to 19%. Despite North America’s continued production growth, it is outpaced by other regions and its share in the global total declines from 26% in 2010 to 19% in 2030. FSU and African production grows strongly to meet export demand.
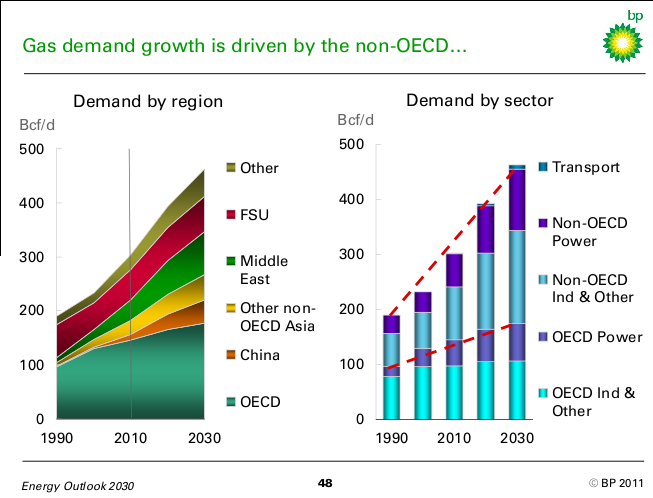
Gas demand growth is driven by the non-OECD...
...and the power sector globally The non-OECD countries account for 80% of the global rise in gas consumption, with growth averaging 3% p.a. to 2030. Demand grows fastest in non-OECD Asia (4.6% p.a.) and the Middle East (3.9% p.a.). Gas grows rapidly in China (7.6% p.a.) to a level of gas use in 2030 (43 Bcf/d) comparable to that of the European Union today (47 Bcf/d). But because of the low starting point, the gas share in China’s primary energy remains relatively low (9% in 2030 vs 4% in 2010). Growth is modest in OECD markets (1% p.a.), particularly in North America. Efficiency gains and low population growth keep industrial and residential sector gas growth at 0.5% p.a. across the OECD. Growth is concentrated in the power sector. Of the major sectors globally, growth is fastest in power (2.6% p.a.) and industry (2% p.a.) – consistent with historic patterns. While trebling from today’s level, compressed natural gas use in transport is confined to 2% of global transport fuel demand in 2030.
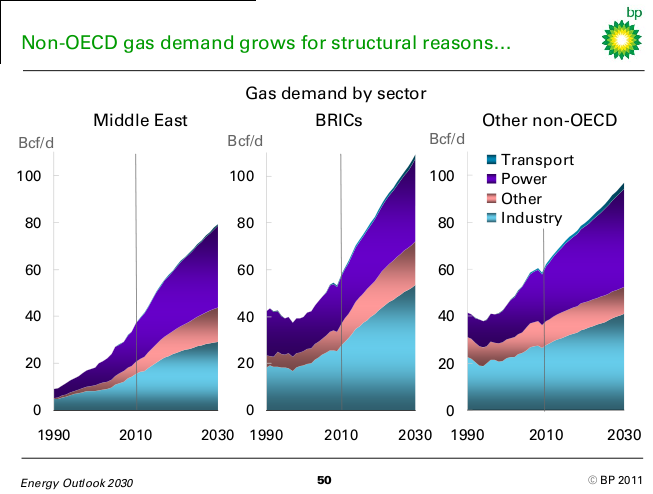
Non-OECD gas demand grows for structural reasons...
...and most rapidly in China, the Middle East, India and Brazil Non-OECD gas use is driven by economic growth, accompanying industrialisation, industrial policy, the power sector and the development of domestic resources. Middle East gas consumption grows 3.9% p.a. over 2010-2030. The power sector accounts for 44% of this growth as domestic gas and imports in some countries displace oil burning. Petrochemical industries are contributing to the projected 3.2% p.a. growth in industrial gas use. Brazil, Russia, India and China (BRICs) contribute 40% to the total non-OECD gas consumption increment. Gas use grows most rapidly in China (7.6% p.a.), India (4.7% p.a.) and Brazil (4.6% p.a.), facilitated by rising domestic production and imports. Industrial activity accounts for 50% and the power sector for 29% of the gas consumption growth. Elsewhere in the non-OECD, gas consumption expands most strongly in power (2.9% p.a.) and industry (2.0% p.a.). Residential, commercial and other sector growth is modest (0.6% p.a.), primarily due to expected efficiency gains in FSU countries outside Russia (-0.6% p.a.).
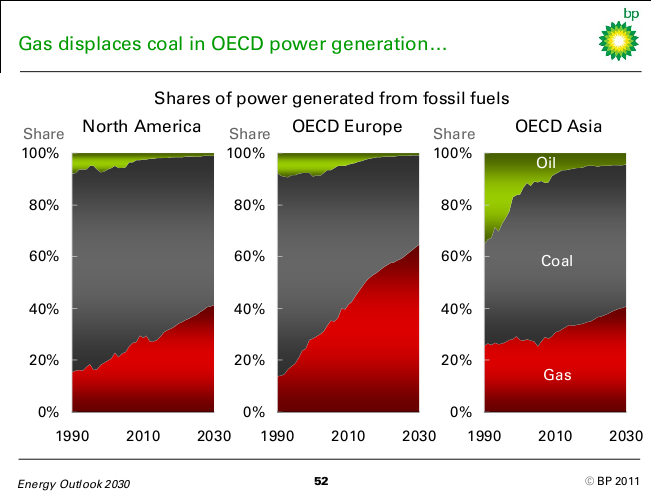
Gas displaces coal in OECD power generation...
...encouraged by environmental policy Our base case assumes policy efforts to curb emissions via carbon prices, mandates and low carbon technologies. The precise policy details will determine the fuel mix – particularly the role of gas. Natural gas used to generate power has half the CO2 emissions of conventional coal power generation and near zero sulphur emissions. Gas is expected to displace coal in power generation across the OECD due to rising carbon prices, permitting constraints for new plants and mandates. Coal displacement is likely to be strongest in Europe, where regulation is most advanced. The gas share in fossil fuel generation grows from 42% in 2010 to 65% in 2030. Yet the growth in renewables means that the gas share in total generation increases modestly from 20% to 24%. In N. America, gas’s share in fossil fuel generation reaches 41% in 2030. Globally, gas is the fastest growing fossil fuel in power generation and grows its share in generation from fossil fuels from 30% today to 37%. Its share in total electricity generation increases from 20.5% to 22%.
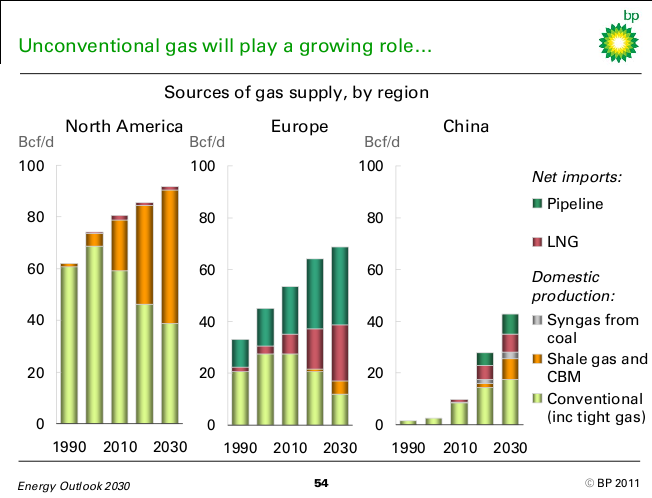
Unconventional gas will play a growing role...
...across the world The world had 6,621 Tcf of proved gas reserves in 2009, sufficient for 63 years of production at current levels. Unconventionals remain to be appraised in detail globally, but could add another 30 years of supply. Unconventionals have transformed the North American gas market. Shale gas and coal bed methane (CBM) are forecast to account for 57% of North American production by 2030 and could make LNG exports economically viable. However, risks from costs and access exist. Outside North America, unconventionals are likely to play a growing role in the future. The ability to overcome technical and regulatory hurdles will determine their pace of development. Absent another technological breakthrough, we only expect significant unconventional production in Europe around 2020. With declining conventional fields, the import requirement is likely to double by 2030. LNG imports in particular would grow. In China, gas production is expected to grow 6% p.a. CBM and shale gas are likely to contribute 41% to this growth, but still leave a rising need for imports in China.
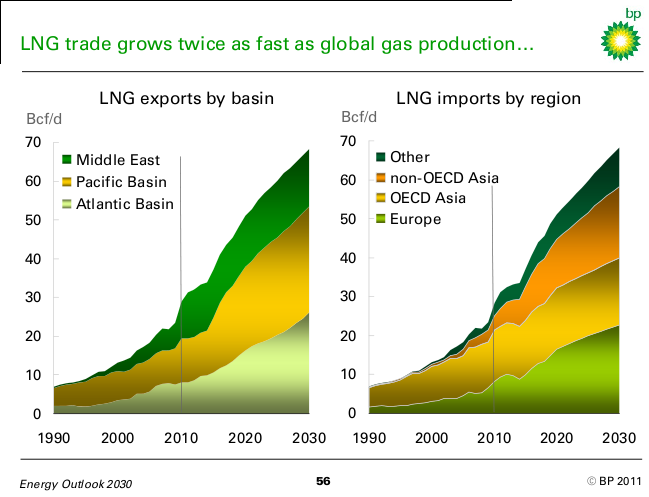
LNG trade grows twice as fast as global gas production...
...and imports grow most in Europe and in non-OECD Asia LNG supply is projected to grow 4.4% p.a. to 2030, more than twice as fast as total global gas production (2.1% p.a.). Its share in global gas supply increases from 9% in 2010 to 15% in 2030. The expansion is in three phases. The first (2009-2011) is predominantly from the Middle East and adds 10 Bcf/d (44%) of LNG. This overhang will dissipate as demand grows and the next significant wave does not occur until 2015. Half of the 10 Bcf/d (29%) growth in the period 2015-2017 is on the start of major Australian projects. The phase to 2030 is largely determined by demand, with 41% of supply coming from Africa. Demand is driven by Europe (5.2% p.a., 36% of the global increment) and non-OECD Asia (8.2% p.a., also 36% of the increment). In Europe, the share of LNG in total imports expands from 30% to 42%. In non-OECD Asia, 74% of the demand growth is from China and India. Middle East net LNG exports could decline after 2020 as regional import growth outweighs output growth from traditional exporters. Australia overtakes Qatar as the world’s largest LNG exporter around 2020.
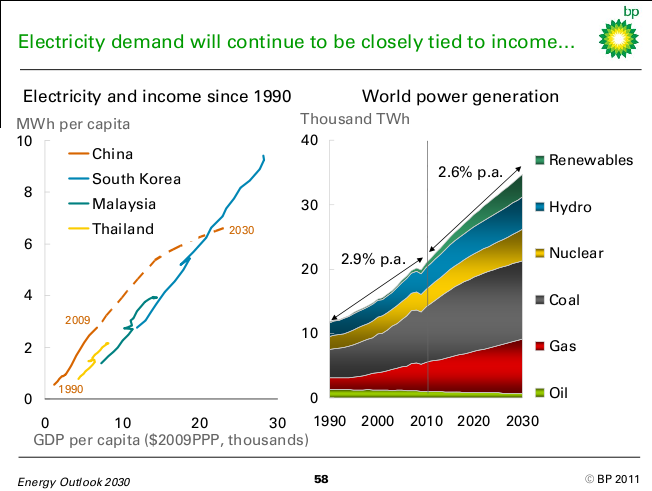
Electricity demand will continue to be closely tied to income...
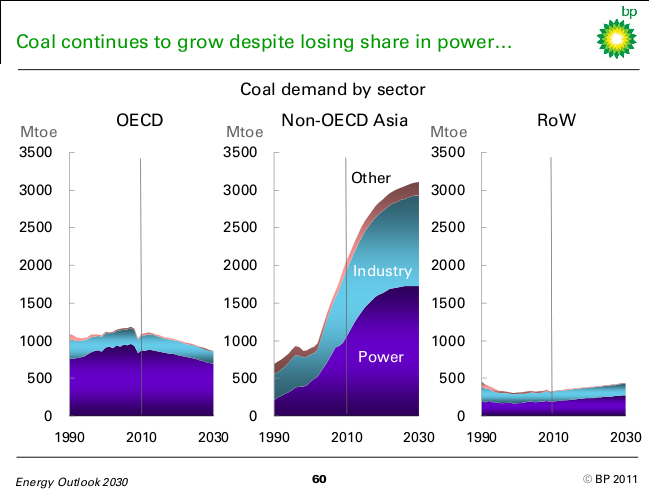
...as power generation shifts to lower carbon fuels Historically there has been a strong correlation between income and electricity demand. We expect that relationship to persist but to be modified by efforts to promote end-use efficiency. The ratio of global electricity growth to GDP growth should fall to 0.7 in our 2010-2030 outlook, from 0.9 (1990-2010). This implies that the industrialising non-OECD economies move rapidly onto a less electricity-intensive path. Power generation in the non-OECD overtakes the OECD by 2012, and continues to grow at more than three times the OECD rate. Despite this, non-OECD electricity consumption per capita remains well below OECD levels. As a percentage of the OECD level, non-OECD per capita consumption increases from 20% today to 30% in 2030. We assume that policy supports the continued rapid growth of non-fossil power generation – especially renewables, which attain a global share of 10% by 2030. Where gas is available at a competitive price, it continues to displace coal. Coal continues to grow despite losing share in power...
...but growth decelerates with non-OECD industrialisation Coal is in decline in the OECD (-1.2% p.a. 2010-30), but this is more than offset by growth in the non-OECD (2% p.a.). In China and India the phase of rapid consumption growth ends around 2020; elsewhere in the non-OECD coal continues to grow steadily. Coal has been central to the recent rapid economic growth of China. China accounts for 47% of global coal consumption today, and this is likely to rise to 53% by 2030. China contributed 80% of the growth of world coal demand 1990-2010, and is expected to account for 77% of the growth to 2030. There is a clear recognition within China that it needs to move away from its heavy dependence on coal. Environmental constraints (local air pollution as much as climate change concerns) and the rising cost of domestic coal resources are expected to curb Chinese coal growth. The timing of this transition to less coal-intensive growth is uncertain. In our outlook, China’s coal consumption flattens by 2030, and world coal growth for the 2020-30 decade averages just 0.3% p.a.
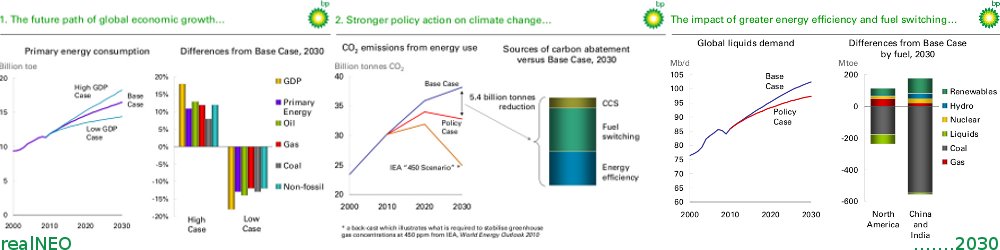
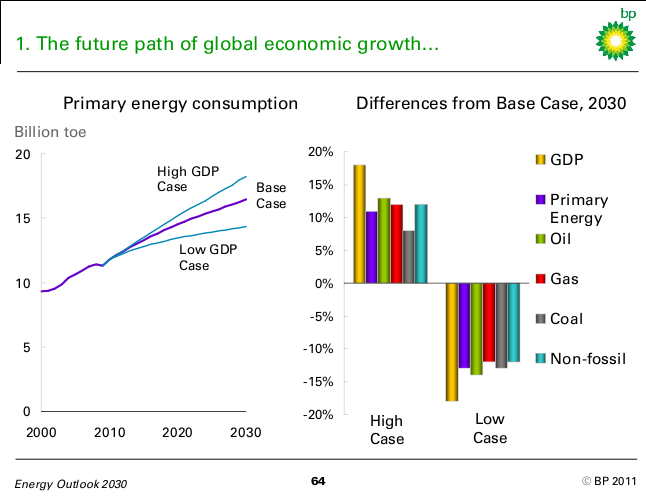
What can bend the trend? 1. The future path of global economic growth...
...is a major source of uncertainty for energy demand The performance of the global economy is key to energy demand growth. Our high and a low growth cases explore the implications for energy markets of different assumptions on the economy. The high case takes an optimistic view on globalisation: expanding international trade flows would support widely-shared long-run growth in productivity and incomes. Adding 0.9% to the long-run growth rate leaves global GDP in 2030 18% higher than in the base case. Total energy demand would be 11% higher than in the base case. The low GDP case assumes that protectionism and other interventions reduce long-run trend growth rates. This cuts one percentage point from the long-run growth rate, leaving global GDP 18% below the base case level, and energy demand would be 13% lower than the base case.
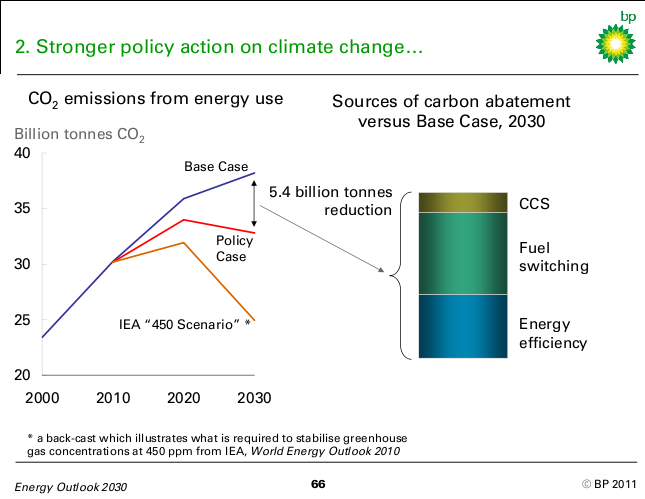
2. Stronger policy action on climate change...
...could see emissions starting to fall by 2030 A Policy Case explores the implications of more aggressive policies to address climate change. We assume that a wide range of policy tools are deployed, including putting a price on carbon. Richer countries achieve significant cuts in carbon emissions, while developing countries focus on reducing the carbon intensity of their economies. In this case, global emissions would peak just after 2020 and be 14% lower than the Base Case by 2030, but still 21% above 2005 levels. The emission reduction is achieved through a combination of more rapid efficiency gains, and switching to lower carbon fuels. There is limited scope for fuel switching in transport, although electric vehicles start to make an impact by 2030, so the main effect here comes through vehicle efficiency. The greatest scope for fuel switching is in power generation, where renewables are the big winner (up 33% versus the base case in 2030) and coal the big loser (down 23%). Gas gains share but loses volume overall.
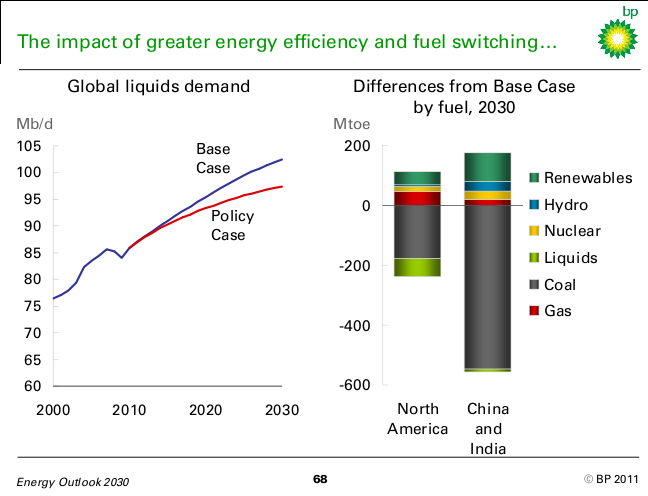
The impact of greater energy efficiency and fuel switching...
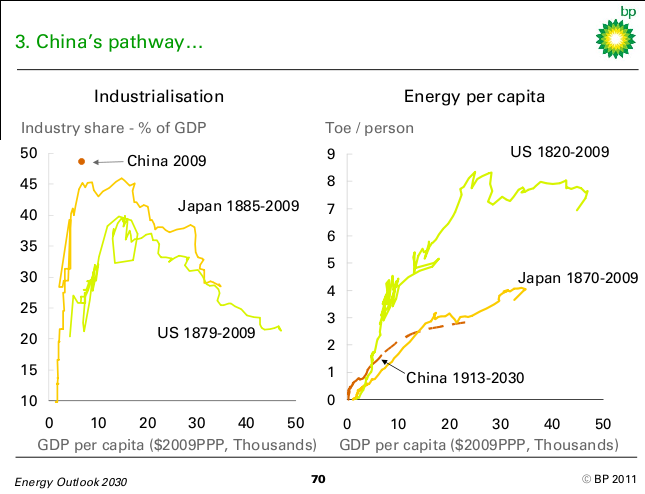
...will differ across fuels and regions in the Policy Case The oil market path in the Policy Case will depend crucially on OPEC’s ability to accommodate lower demand and to manage prices. As with other fuels, lower oil prices (because of lower demand) counteract the initial demand response to stricter policies. Netting out these effects, global liquids demand is expected to grow to 97.5 Mb/d (0.6% p.a.) to 2030 – 5 Mb/d below the base case. Consumption declines are likely to be concentrated in the OECD (with the most aggressive policies) and the Middle East and FSU (where oil intensity is highest). For other fuels, local supply-demand conditions will shape the path. Efficiency gains and low carbon technologies will constrain the use of gas and coal in most countries. However, gas is likely to gain share from coal globally due to its lower CO2 intensity in power generation. In North America and China in particular, sizeable switching opportunities from coal remain and indigenous gas production could grow more strongly on further technological progress and policy support. We thus expect local gas use to increase in our Policy Case. 3. China’s pathway...
...shows relatively low energy growth China will be the world’s biggest economy by 2030, and the question has often been raised as to whether energy growth can be sufficient to support high economic growth in China, or indeed in the wider group of industrialising countries. In our outlook, China’s growth will become significantly less energy intensive after 2020. In part, this reflects China following the typical path of economic development, as it passes through a peak in the share of industry in GDP as incomes rise. Also, China has a long-term strategy of promoting less energy intensive development, and we assume China is successful. The scale of China’s energy requirements is such that it has an impact on global energy markets, and prices. Energy prices (or supplies) could indeed become a temporary constraint on growth. In this regard, China is merely the most visible example of a large group of rapidly industrialising economies in the non-OECD.
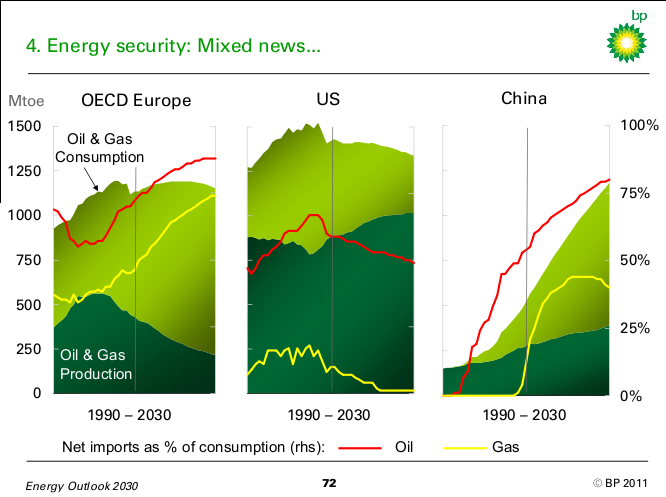
4. Energy security: Mixed news...
...on the gap between consumption and production Energy trade continues to increase; the implications for the gap between production and consumption (a proxy for net imports) vary by region and fuel. The import share of oil and gas in the US will fall to levels not seen since the 1980s, largely due to rising domestic production of natural gas and ethanol (which displaces oil imports). Three-quarters of the overall reduction in net imports is from oil. European net imports (and imports as a share of consumption) rise significantly as declining domestic production – and rising gas consumption – more than outpace declining consumption. Virtually all of the growth in net imports is from natural gas. In China, imports of oil and natural gas rise sharply as demand growth outpaces domestic supply. Oil imports rise nearly threefold and continue to dominate China's energy imports, although gas imports increase by a factor of fourteen. China also remains a net importer of coal.
Key themes Energy and the economy Global energy consumption growth continues, driven by industrialisation in the developing world – but efficiency improvements are likely to accelerate.
Global fuel mix The global fuel mix continues to diversify – and for the first time, non-fossil fuels will be major sources of supply growth.
Energy and carbon emissions Energy policy and technology lead to a slow-down in the growth of CO2 emissions from energy use – but not fast enough to put the world on a safe carbon trajectory.
Emerging energy patterns Energy policy is driven by security as well as by climate change concerns – with diverse outcomes across fuels and regions.
BP Energy Outlook 2030 - London, January 2011 Disclaimer This presentation contains forward-looking statements, particularly those regarding global economic growth, population growth, energy consumption, policy support for renewable energies and sources of energy supply. Forward-looking statements involve risks and uncertainties because they relate to events, and depend on circumstances, that will or may occur in the future. Actual results may differ depending on a variety of factors, including product supply, demand and pricing; political stability; general economic conditions; legal and regulatory developments; availability of new technologies; natural disasters and adverse weather conditions; wars and acts of terrorism or sabotage; and other factors discussed elsewhere in this presentation. Note on method and assumptions This outlook is not a “business as usual” extrapolation, or an attempt at modelling policy targets. Instead it is built “to the best of our knowledge”, reflecting our judgement of the likely path of global energy markets to 2030. Assumptions on changes in policy, technology and the economy are based on extensive internal and external consultations. The Policy Case is a fully built-up alternative case, assessing the impact of possible policy changes on energy production and consumption. We use this case – and other sensitivities– to explore the uncertainties of the Energy Outlook. We do not attempt to forecast long term energy prices as part of this Outlook. Historical energy data is fully compatible with the BP Statistical Review of World Energy. Gross Domestic Product (GDP) is expressed in real Purchasing Power Parity (PPP) terms. All data sources are listed on page 80. Contents/Page Introduction 4 Global energy trends 7 Oil (and other liquid fuels) 25 Gas, power and coal 45 What can bend the trend? 63 Key themes 75 Data sources 80 Data sources BP p.l.c., BP Statistical Review of World Energy, London, United Kingdom, June 2010 Cedigaz, Paris, France Energy Information Administration, Washington, D.C., United States Etemad, B., J. Luciani, P. Bairoch, and J.-C. Toutain, World Energy Production 1800-1985, Librarie DROZ, Switzerland, 1991 International Energy Agency, CO2 Emissions from Fuel Combustion, Paris, France, 2010 International Energy Agency, Energy Balances of Non-OECD Countries, Paris, France, various editions up to 2010 International Energy Agency, Energy Balances of OECD Countries, Paris, France, various editions up to 2010 International Energy Agency, World Energy Outlook 2010, Paris, France, 2010 Maddison, A., Statistics on World Population, GDP and Per Capita GDP, 1-2008 AD, 2009 Mitchell, B.R., International Historical Statistics, Palgrave Macmillan, New York, United States, various editions up to 2007 Oxford Economics Ltd, Oxford, UK United Nations Population Division, UN World Population Prospects: 2008 Revision, New York, United States, 2009 United Nations Statistics Division, National Accounts Statistics, New York, United States, 2011 Waterborne Energy, Inc., Houston, Texas World Bank, 2005 International Comparison Program, Washington, D.C., United States, 2008 Plus various national sources Historical data compilation: Energy Academy, Heriot-Watt University, Edinburgh, United Kingdom BP Energy Outlook 2030 - London, January 2011
( categories:
|
Support Civic Journalism Recent commentsPopular contentToday's:
All time:Last viewed:
|

BP Says Future Of Carbon Pollution Should Be ‘Wake Up Call"
From The Wonk Room, on Think Progress, about Welcome to BP’s Energy Outlook 2030
BP’s estimate is just higher than ExxonMobil, which believes that CO2 emissions will increase by 25 percent in 20 years, which, according to John Vidal, writing in the Guardian, in effect dismisses “hopes that runaway climate change can be arrested and massive loss of life prevented.”
These projections by BP and Exxon scientists are even gloomier the projections of the U.S. Energy Information Administration, which projectst that energy-related CO2 emissions will “grow by 16 percent from 2009 to 2035.” Exxon argues that oil will still be king in 2030:
BP too has demand for fossil fuels rising: BP’s “base case” — or most likely projection — points to primary energy use growing by nearly 40 percent over the next twenty years, with 93% of the growth coming from non-OECD countries. The BP report argues that world energy growth over the next twenty years is expected to be dominated by emerging economies such as China, India, Russia and Brazil. Natural gas is also expected to be the fastest growing fossil fuel, with coal and oil losing market share as fossil fuels as a whole experience a slow decline in growth, falling from 83 percent to 64 percent. Coal will increase by 1.2 percent per year and by 2030 it is likely to provide virtually as much energy as oil, excluding biofuels.
There is some good news that energy diversification will continue. Between 2010 to 2030 the contribution to energy growth of renewables (solar, wind, geothermal and biofuels) is seen to increase from 5 to 18 percent.
What oil there is left is predominantly under OPEC control. OPEC’s share of global oil production is set to increase to 46%, a position not seen since 1977, the decade that saw the cartel preside over a series of oil shocks and shortages. In fact, 75 percent of all growth in oil reserves over the next two decades is expected to come from OPEC nations, which include Kuwait, Iran, Angola, Libya, Saudi Arabia, Iraq and Nigeria.
Disrupt IT