Submitted by Norm Roulet on Wed, 04/14/2010 - 11:59.
As the world and America move forward from an age of rampant, generational, systematically-enabled global corporate, government and individual leadership incompetency, corruption, excess, conflict and greed punctuated by widespread warmongering and the rising and bursting of global energy, military, housing and financial markets, and an escalation of climate change, throughout the first decade of the 2000s, some of the great concerns of the world's legitimate economists now center on the transference of wealth and opportunity from excessively greedy individuals and enterprises - which have been riding a wave of imperfect monopoly wealth creation and productivity realignments, only benefiting large corporate executives and stockholders - to now benefit excessively impoverished common workers, who are heavily underemployed and outside the power/elite fountain of trickle-down opportunity proposed to be the benefit of unenlightened contemporary "capitalism", as we have seen over the past several decades.
In response to excessive global debt and default, interest rates shall be increased for government, enterprises and individuals worldwide... concerns over and harms from debts and inflation shall be omnipresent for the next several years, under the best of circumstances.
Such concerns dampen broad investment, spending and economic growth patterns world-wide, dampening business activity and equitable wealth creation and transfer, and so dampen the income of the ordinary people, causing downward economic pressure. Less money to the people, under increasing inflation and tight monetary policy, may shift many factors of the US and global economies back downward, and cause a deeper recession than that from which we are currently recovering, as we may not finance another false recovery with more debt, at higher cost.
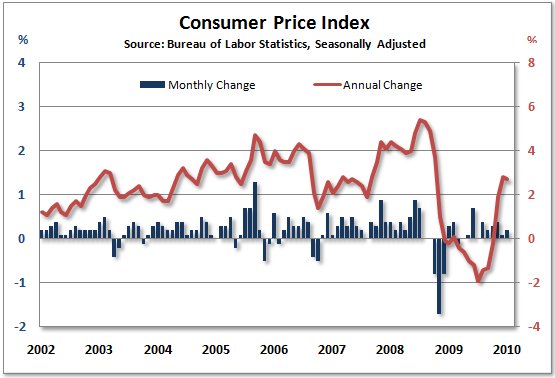
Thus, it is good news that the Consumer Price Index for All Urban Consumers (CPI-U) increased only
0.1 percent in March, the U.S. Bureau of Labor Statistics reported today (see below) - the CPI-U was flat in February.
We are now a full year past the first-break turning-points in what has been more like a depression than recession, for people in many parts of America and the world, and we see early indicators of employment and other financial conditions improving in most sectors of the US economy, with limited inflationary pressure to date.
With money supplies and credit markets already tight and interest rates trending upward, and with energy prices and supplies that are far from stable, over the last 12 months the CPI-U increased 2.3 percent, before seasonal adjustment.
The index for energy and for all items less food and energy were both unchanged in March.
However, for those interested in the local foods economy, it is worth noting "the seasonally adjusted increase in the all items index was mostly due to an increase in the fresh fruits and vegetables index, which rose 4.6 percent in March and accounted for over 60 percent of the all items increase."
Considering the unhealthy nature of a large percentage of the US and global populations today, with obesity and malnutrition-related illnesses at historic highs, world-wide, expect to see increased pressure on the existing shift of market demand away from processed food and toward fresh food, building demand pressure for local, natural and organic food products. When supply lags demand, prices rise.
Further, as the price of a barrel of oil has increased, in response to shifting demand, the cost of transportation, farming, and food-related oil products, like plastic and fertilizer, remain an immediate and lasting concern, as those oil-related costs impact food costs.
The faster regions develop natural food security, with strategic local food production, the faster inflation for food may be better isolated from inflation from oil. For now, the two factors are highly interrelated, and have upside price pressure for the foreseeable future. Poor weather, war developments, social unrest and natural disasters may drive these already unpredictable markets into huge fluctuation at unforeseen times.
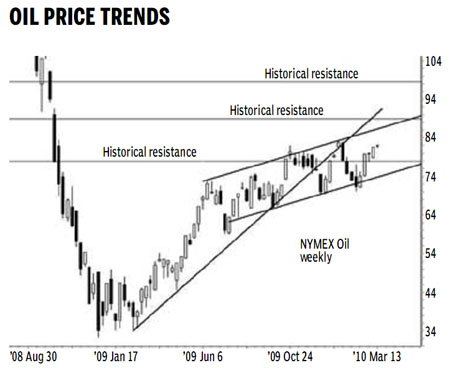
Be concerned about fuel and energy costs in the coming several years - especially while we are in deep conflict in the Middle East and worldwide - as oil prices are expected to continue to trend upward for the foreseeable future and remain unstable and drive many other cost factors that may lead to inflation. High inflation, under current economic conditions, will cause extreme hardship to a high percentage of the world's people, and cause a nightmare in common people's current economic recovery dreaming.
People around the world need reasons to be confident in the economy, for the US and global economies to continue to show broad trends of recovery and transformation beyond the age of excess. Inflation will break the recovery's knees.
So far so good on the US inflation front, President Obama.
Here is a text version of the full release, from the BLS:
Transmission of material in this release is embargoed until
8:30 a.m. (EDT) Wednesday, April 14, 2010
Technical information: (202) 691-7000 Reed [dot] Steve [at] bls [dot] gov
www.bls.gov/cpi
Media Contact: (202) 691-5902 PressOffice [at] bls [dot] gov
Consumer Price Index - March 2010
On a seasonally adjusted basis, the Consumer Price Index for All
Urban Consumers (CPI-U) increased 0.1 percent in March, the U.S.
Bureau of Labor Statistics reported today. Over the last 12 months,
the index increased 2.3 percent before seasonal adjustment.
The seasonally adjusted increase in the all items index was mostly
due to an increase in the fresh fruits and vegetables index, which
rose 4.6 percent in March and accounted for over 60 percent of the
all items increase. Other food at home indexes were mixed and the
index for food away from home was unchanged.
The index for energy and for all items less food and energy were both
unchanged in March. Within energy, an increase in the electricity
index was offset by declines in the indexes for gasoline and natural
gas. Within all items less food and energy, the indexes for medical
care, new vehicles, and used cars and trucks posted increases, while
the indexes for shelter, household furnishings and operations, and
apparel declined.
Table A. Percent changes in CPI for All Urban Consumers (CPI-U): U.S. city
average
Seasonally adjusted changes from
preceding month
Un-
adjusted
12-mos.
Sep. Oct. Nov. Dec. Jan. Feb. Mar. ended
2009 2009 2009 2009 2010 2010 2010 Mar.
2010
All items.................. .2 .2 .2 .2 .2 .0 .1 2.3
Food...................... -.1 .0 .1 .1 .2 .1 .2 .2
Food at home............. -.3 .0 .0 .2 .4 .1 .5 -.7
Food away from home (1).. .1 .1 .2 .1 .1 .1 .0 1.2
Energy.................... .6 .6 2.2 .8 2.8 -.5 .0 18.3
Energy commodities....... 1.1 .4 3.0 1.6 4.9 -1.3 -1.0 39.6
Gasoline (all types).... .9 .3 2.7 2.3 4.4 -1.4 -.8 41.4
Fuel oil (1)............ -.3 2.2 7.4 .0 6.1 -2.4 .7 27.2
Energy services.......... -.1 .8 1.1 -.3 .0 .5 1.4 -1.8
Electricity............. .3 .8 1.2 -.2 -1.1 -.5 2.1 -.5
Utility (piped) gas
service.............. -1.5 .7 .9 -.7 3.5 3.9 -.7 -5.5
All items less food and
energy................. .2 .2 .0 .1 -.1 .1 .0 1.1
Commodities less food and
energy commodities.... .3 .4 .2 .1 .1 -.1 -.1 1.9
New vehicles............ .3 1.4 .5 -.2 -.5 .1 .1 3.0
Used cars and trucks.... 1.7 3.1 1.9 2.2 1.5 .7 .5 16.3
Apparel................. .2 -.3 -.3 .4 -.1 -.7 -.4 -.4
Medical care commodities
(1).................. .6 .2 .1 -.1 .7 .8 .4 3.7
Services less energy
services.............. .1 .1 .0 .1 -.2 .1 .1 .8
Shelter................. .0 .0 -.2 .0 -.5 .0 -.1 -.6
Transportation services .7 .5 .5 .3 -.3 .4 .4 3.8
Medical care services... .3 .2 .3 .2 .5 .4 .3 3.8
1 Not seasonally adjusted.
Consumer Price Index Data for March 2010
Food
The food index rose 0.2 percent in March after rising 0.1 percent in
February. The index for food away from home, which had increased
every month since January 2003, was unchanged in March. In contrast,
the index for food at home rose 0.5 percent, its largest increase
since September 2008. The index for fruits and vegetables rose 3.4
percent due to the sharp rise in the fresh fruits and vegetables
index. Other grocery store food groups registered only small changes
in March. The meats, poultry, fish, and eggs index increased 0.2
percent, while the indexes for dairy and related products and for
nonalcoholic beverages were unchanged and the indexes for cereals and
bakery products and for other food at home declined slightly. The
food index has risen 0.2 percent over the last 12 months, with the
food at home index still down 0.7 percent over that period despite
the March increase.
Energy
The energy index, which fell 0.5 percent in February, was unchanged
in March. The gasoline index declined for the second straight month,
falling 0.8 percent. (Before seasonal adjustment, gasoline prices
rose 4.5 percent in March and have increased 41.4 percent over the
past 12 months.) The index for household energy rose in March,
increasing 1.3 percent mostly because of a 2.1 percent rise in the
electricity index. The fuel oil index rose 0.7 percent, but the index
for natural gas declined 0.7 percent. Over the last 12 months the
energy index has risen 18.3 percent.
All items less food and energy
The index for all items less food and energy was unchanged in March
after rising 0.1 percent in February. The shelter index declined in
March, falling 0.1 percent due to a 0.1 percent decline in owners'
equivalent rent. The index for household furnishings and operations
fell 0.4 percent in March, its ninth decline in the past 10 months.
The index for apparel fell 0.4 percent and the recreation index
declined 0.1 percent. In contrast to these declines, the medical care
index rose 0.3 percent in March with the index for hospital services
increasing 1.1 percent. The index for used cars and trucks continued
to rise, increasing 0.5 percent, and the new vehicles index rose 0.1
percent. Over the last 12 months the index for all items less food
and energy has risen 1.1 percent, its smallest increase since January
2004. This is largely explained by the continued deceleration of the
shelter index, which has now fallen 0.6 percent over the last 12
months.
Not seasonally adjusted CPI measures
The Consumer Price Index for All Urban Consumers (CPI-U) increased
2.3 percent over the last 12 months to an index level of 217.631
(1982-84=100). For the month, the index rose 0.4 percent prior to
seasonal adjustment.
The Consumer Price Index for Urban Wage Earners and Clerical Workers
(CPI-W) increased 3.0 percent over the last 12 months to an index
level of 213.525 (1982-84=100). For the month, the index rose 0.5
percent prior to seasonal adjustment.
The Chained Consumer Price Index for All Urban Consumers (C-CPI-U)
increased 2.5 percent over the last 12 months. For the month, the
index increased 0.4 percent on a not seasonally adjusted basis.
Please note that the indexes for the post-2008 period are subject to
revision.
The Consumer Price Index for April 2010 is scheduled to be released
on Wednesday, May 19, 2010, at 8:30 a.m. (EDT).
Facilities for Sensory Impaired
Information from this release will be made available to sensory
impaired individuals upon request. Voice phone: 202-691-5200,
Federal Relay Services: 1-800-877-8339.
Brief Explanation of the CPI
The Consumer Price Index (CPI) is a measure of the average change in
prices over time of goods and services purchased by households. The
Bureau of Labor Statistics publishes CPIs for two population groups:
(1) the CPI for Urban Wage Earners and Clerical Workers (CPI-W),
which covers households of wage earners and clerical workers that
comprise approximately 32 percent of the total population and (2) the
CPI for All Urban Consumers (CPI-U) and the Chained CPI for All Urban
Consumers (C-CPI-U), which cover approximately 87 percent of the
total population and include in addition to wage earners and clerical
worker households, groups such as professional, managerial, and
technical workers, the self-employed, short-term workers, the
unemployed, and retirees and others not in the labor force.
The CPIs are based on prices of food, clothing, shelter, and fuels,
transportation fares, charges for doctors' and dentists' services,
drugs, and other goods and services that people buy for day-to-day
living. Prices are collected each month in 87 urban areas across the
country from about 4,000 housing units and approximately 25,000
retail establishments-department stores, supermarkets, hospitals,
filling stations, and other types of stores and service
establishments. All taxes directly associated with the purchase and
use of items are included in the index. Prices of fuels and a few
other items are obtained every month in all 87 locations. Prices of
most other commodities and services are collected every month in the
three largest geographic areas and every other month in other areas.
Prices of most goods and services are obtained by personal visits or
telephone calls of the Bureau's trained representatives.
In calculating the index, price changes for the various items in each
location are averaged together with weights, which represent their
importance in the spending of the appropriate population group.
Local data are then combined to obtain a U.S. city average. For the
CPI-U and CPI-W separate indexes are also published by size of city,
by region of the country, for cross-classifications of regions and
population-size classes, and for 27 local areas. Area indexes do not
measure differences in the level of prices among cities; they only
measure the average change in prices for each area since the base
period. For the C-CPI-U data are issued only at the national level.
It is important to note that the CPI-U and CPI-W are considered final
when released, but the C-CPI-U is issued in preliminary form and
subject to two annual revisions.
The index measures price change from a designed reference date. For
the CPI-U and the CPI-W the reference base is 1982-84 equals 100.0.
The reference base for the C-CPI-U is December 1999 equals 100. An
increase of 16.5 percent from the reference base, for example, is
shown as 116.5. This change can also be expressed in dollars as
follows: the price of a base period market basket of goods and
services in the CPI has risen from $10 in 1982-84 to $11.65.
For further details visit the CPI home page on the Internet at
http://www.bls.gov/cpi/ or contact our CPI Information and Analysis
Section on (202) 691-7000.
Note on Sampling Error in the Consumer Price Index
The CPI is a statistical estimate that is subject to sampling error
because it is based upon a sample of retail prices and not the
complete universe of all prices. BLS calculates and publishes
estimates of the 1-month, 2-month, 6-month and 12-month percent
change standard errors annually, for the CPI-U. These standard error
estimates can be used to construct confidence intervals for
hypothesis testing. For example, the estimated standard error of the
1 month percent change is 0.04 percent for the U.S. All Items
Consumer Price Index. This means that if we repeatedly sample from
the universe of all retail prices using the same methodology, and
estimate a percentage change for each sample, then 95% of these
estimates would be within 0.08 percent of the 1 month percentage
change based on all retail prices. For example, for a 1-month change
of 0.2 percent in the All Items CPI for All Urban Consumers, we are
95 percent confident that the actual percent change based on all
retail prices would fall between 0.12 and 0.28 percent. For the
latest data, including information on how to use the estimates of
standard error, see "Variance Estimates for Price Changes in the
Consumer Price Index, January-December 2008". These data are
available on the CPI home page (http://www.bls.gov/cpi), or by using
the following link http://www.bls.gov/cpi/cpivar2008.pdf
Calculating Index Changes
Movements of the indexes from one month to another are usually
expressed as percent changes rather than changes in index points,
because index point changes are affected by the level of the index in
relation to its base period while percent changes are not. The
example below illustrates the computation of index point and percent
changes.
Percent changes for 3-month and 6-month periods are expressed as
annual rates and are computed according to the standard formula for
compound growth rates. These data indicate what the percent change
would be if the current rate were maintained for a 12-month period.
Index Point Change
CPI
202.416
Less previous index
201.800
Equals index point change
.616
Percent Change
Index point difference
.616
Divided by the previous index
201.800
Equals
0.003
Results multiplied by one hundred
0.003x100
Equals percent change
0.3
Regions Defined
The states in the four regions shown in Tables 3 and 6 are listed
below.
The Northeast--Connecticut, Maine, Massachusetts, New Hampshire, New
York, New Jersey, Pennsylvania, Rhode Island, and Vermont.
The Midwest--Illinois, Indiana, Iowa, Kansas, Michigan, Minnesota,
Missouri, Nebraska, North Dakota, Ohio, South Dakota, and Wisconsin.
The South--Alabama, Arkansas, Delaware, Florida, Georgia, Kentucky,
Louisiana, Maryland, Mississippi, North Carolina, Oklahoma, South
Carolina, Tennessee, Texas, Virginia, West Virginia, and the District
of Columbia.
The West--Alaska, Arizona, California, Colorado, Hawaii, Idaho,
Montana, Nevada, New Mexico, Oregon, Utah, Washington, and Wyoming.
A Note on Seasonally Adjusted and Unadjusted Data
Because price data are used for different purposes by different
groups, the Bureau of Labor Statistics publishes seasonally adjusted
as well as unadjusted changes each month.
For analyzing general price trends in the economy, seasonally
adjusted changes are usually preferred since they eliminate the
effect of changes that normally occur at the same time and in about
the same magnitude every year--such as price movements resulting from
changing climatic conditions, production cycles, model changeovers,
holidays, and sales.
The unadjusted data are of primary interest to consumers concerned
about the prices they actually pay. Unadjusted data also are used
extensively for escalation purposes. Many collective bargaining
contract agreements and pension plans, for example, tie compensation
changes to the Consumer Price Index before adjustment for seasonal
variation.
Seasonal factors used in computing the seasonally adjusted indexes
are derived by the X-12-ARIMA Seasonal Adjustment Method. Seasonally
adjusted indexes and seasonal factors are computed annually. Each
year, the last 5 years of seasonally adjusted data are revised. Data
from January 2005 through December 2009 were replaced in January
2010. Exceptions to the usual revision schedule were: the updated
seasonal data at the end of 1977 replaced data from 1967 through
1977; and, in January 2002, dependently seasonally adjusted series
were revised for January 1987-December 2001 as a result of a change
in the aggregation weights for dependently adjusted series. For
further information, please see "Aggregation of Dependently Adjusted
Seasonally Adjusted Series," in the October 2001 issue of the CPI
Detailed Report.
The seasonal movement of all items and 54 other aggregations is
derived by combining the seasonal movement of 73 selected components.
Each year the seasonal status of every series is reevaluated based
upon certain statistical criteria. If any of the 73 components
change their seasonal adjustment status from seasonally adjusted to
not seasonally adjusted, not seasonally adjusted data will be used in
the aggregation of the dependent series for the last 5 years, but the
seasonally adjusted indexes will be used before that period. Note:
46 of the 73 components are seasonally adjusted for 2010.
Seasonally adjusted data, including the all items index levels, are
subject to revision for up to five years after their original
release. For this reason, BLS advises against the use of these data
in escalation agreements.
Effective with the calculation of the seasonal factors for 1990, the
Bureau of Labor Statistics has used an enhanced seasonal adjustment
procedure called Intervention Analysis Seasonal Adjustment for some
CPI series. Intervention Analysis Seasonal Adjustment allows for
better estimates of seasonally adjusted data. Extreme values and/or
sharp movements which might distort the seasonal pattern are
estimated and removed from the data prior to calculation of seasonal
factors. Beginning with the calculation of seasonal factors for
1996, X-12-ARIMA software was used for Intervention Analysis Seasonal
Adjustment.
For the seasonal factors introduced in January 2010, BLS adjusted 30
series using Intervention Analysis Seasonal Adjustment, including
selected food and beverage items, motor fuels, electricity and
vehicles. For example, this procedure was used for the Motor fuel
series to offset the effects of events such as damage to oil
refineries from Hurricane Katrina.
For a complete list of Intervention Analysis Seasonal Adjustment
series and explanations, please refer to the article "Intervention
Analysis Seasonal Adjustment", located on our website at
http://www.bls.gov/cpi/cpisapage.htm.
For additional information on seasonal adjustment in the CPI, please
write to the Bureau of Labor Statistics, Division of Consumer Prices
and Price Indexes, Washington, DC 20212 or contact David Levin at
(202) 691-6968, or by e-mail at Levin [dot] David [at] bls [dot] gov If you have
general questions about the CPI, please call our information staff at
(202) 691-7000.
Last Modified Date: April 14, 2010

