The U.S. Bureau of Labor Statistics just released its U.S. IMPORT AND EXPORT PRICE INDEXES – FEBRUARY 2011 - reporting ongoing significant price increase trends in core sectors of the global economy - like US import and export food and energy prices - that indicate US annual inflation in the double-digits for many products and services impacting daily life in America... like the price of gasoline, milk and bread. The impacts worldwide - especially in developing countries - will be staggering... radicalizing.
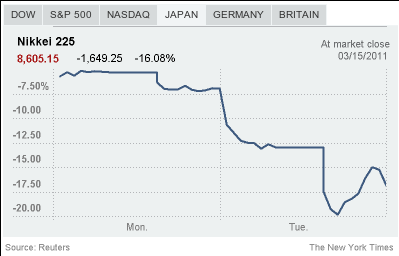
All that real bad economic news, before impacts of growing environmental, human, political, social and economic disasters melting-down life and confidence in Japan and Asia, the Middle East, Africa and North America - from the real impacts of $100+/barrel oil and revolutions in the Middle East... to nuclear disaster in Japan contaminating all life on Earth - have remotely begun to sink in... beyond tanking all world financial markets on this very Black Tuesday, as already reported in the New York Times by 10 AM today [1]:
Japan’s earthquake, tsunami and the nuclear accident are “a negative shock to the world economy,” Mr. Chandler said. Analysts said the potential disruption to global economic supply lines in Japan, home to some of the world’s biggest manufacturing and technology companies, could ripple through the economies of other countries, including the United States, and increase the risk of a global slowdown.
“Japan’s economic prospects, as the world’s third-largest national economy and fourth-most important international trader, affects us all,” Mr. Weinberg said.
On the brightest side one may find, in this news... the NY Times does point out: Oil down more than 3 percent. “People are asking what kind of disruption this means for the global economy. Some think it is going to mean less demand for oil.”
That is fortunate, as the US BLS reports "Fuel prices rose 18.6 percent over the past 12 months, led by a 20.6 percent jump in petroleum prices".
Oil down 3% - big deal.
Add all the real market fear and bad economic reality to real rising import and export price news, from the US BLS, to begin seeing the big picture forming ahead, which appears to come stright from the mind of Bosch.

Some Hellish highlights:
Fuel Imports: Fuel prices increased 4.0 percent in February following a 3.5 percent advance the previous month. Rising prices for both petroleum and natural gas factored into the February increase, advancing 3.7 percent and 12.1 percent, respectively. Fuel prices rose 18.6 percent over the past 12 months, led by a 20.6 percent jump in petroleum prices.
The price index for nonfuel imports increased 3.6 percent the past year, the largest 12-month advance since a 4.8 percent increase between October 2007 and October 2008. The current 12-month rise was mostly driven by a 12.9 percent advance for nonfuel industrial supplies and materials prices and a 15.8 percent increase for foods, feeds, and beverages prices.
Foods, feeds, and beverages prices rose 0.8 percent in February following a 2.5 percent increase the previous month. In February, rising prices for meat, food oils, fruit, and coffee, up 7.2 percent, 5.6 percent, 2.9 percent, and 3.9 percent, respectively, more than offset a 6.4 percent drop in vegetable prices and a 3.9 percent decline in the price index for bakery and confectionery products.
All Exports: Export prices rose 1.2 percent in January following a 1.3 percent advance the previous month. The index has risen at least 0.6 percent every month since a 0.2 percent decline in July 2010. The price index for overall exports increased 8.6 percent over the past year, the largest 12-month advance since a 10.2 percent rise for the year ended in July 2008.
Agricultural Exports: Agricultural exports advanced 4.4 percent in February and 33.5 percent over the past 12 months. The price index for agricultural exports is at the highest level since the index was first published. in March 1985, and the year-over-year increase in February was the largest since a 39.7 percent surge for the July 2007-08 period. Rising cotton prices, up 15.7 percent in February and 153.5 percent over the past year, had the largest contribution to both the February and 12-month advances for agricultural prices. Prices for corn, wheat, and soybeans, which rose 7.9 percent, 11.0 percent, and 3.4 percent, respectively, in February, also continued an upward trend.
U.S. Bureau of Labor Statistics U.S. IMPORT AND EXPORT PRICE INDEXES – FEBRUARY 2011 - USDL-11-0348 (Download .PDF with data tables here - 204Kb [2])
Transmission of material in this release is embargoed until 8:30 a.m. (EDT) Tuesday, March 15, 2011
U.S. IMPORT AND EXPORT PRICE INDEXES – FEBRUARY 2011
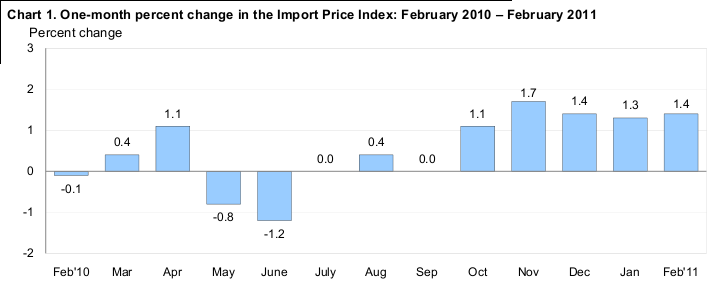
U.S. import prices rose 1.4 percent in February, the U.S. Bureau of Labor Statistics reported today, following a similar 1.3 percent advance in January. The price index for U.S. exports increased 1.2 percent in February after rising 1.3 percent the previous month. Higher agricultural and nonagricultural export prices each contributed to the overall advance in February.
Chart 1. One-month percent change in the Import Price Index: February 2010 – February 2011
Percent change
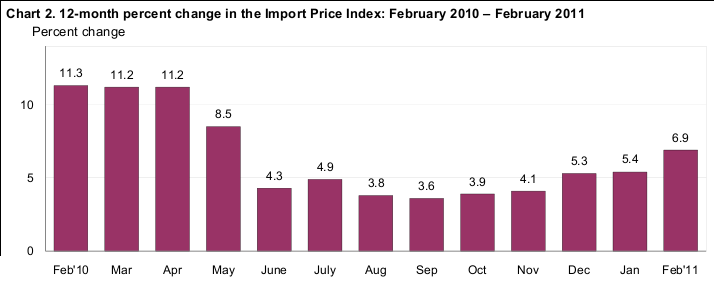
Chart 2. 12-month percent change in the Import Price Index: February 2010 – February 2011
Percent change
All Imports: Prices for imports rose 1.4 percent in February, continuing a five-month trend of monthly
increases greater than 1.0 percent. Import prices advanced 6.9 percent for the year ended in February, driven
by a 7.0 percent jump for the index over the past five months. The year-over-year rise in February was the
largest 12-month advance since an 8.5 percent increase for the year ended in May 2010. Higher prices for
both fuel and nonfuel import prices contributed to the increase in February and over the past year.Fuel Imports: Fuel prices increased 4.0 percent in February following a 3.5 percent advance the previous
month. Rising prices for both petroleum and natural gas factored into the February increase, advancing 3.7
percent and 12.1 percent, respectively. Fuel prices rose 18.6 percent over the past 12 months, led by a 20.6
percent jump in petroleum prices. Despite rising 23.4 percent over the past two months, however, natural
gas prices declined 10.9 percent between February 2010 and February 2011.All Imports Excluding Fuel: Nonfuel import prices advanced 0.3 percent in February after a 0.7 percent
increase in January. Higher prices for nonfuel industrial supplies and materials; foods, feeds, and beverages;
and each of the major finished goods categories all contributed to the rise in nonfuel prices in February. The
price index for nonfuel imports increased 3.6 percent the past year, the largest 12-month advance since a 4.8
percent increase between October 2007 and October 2008. The current 12-month rise was mostly driven by
a 12.9 percent advance for nonfuel industrial supplies and materials prices and a 15.8 percent increase for
foods, feeds, and beverages prices.Table A. Percent changes
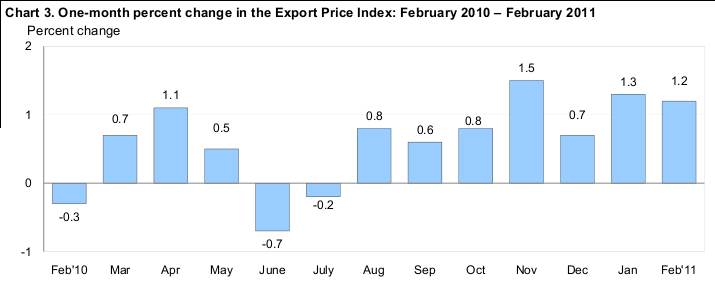
Chart 3. One-month percent change in the Export Price Index: February 2010 – February 2011
Percent change
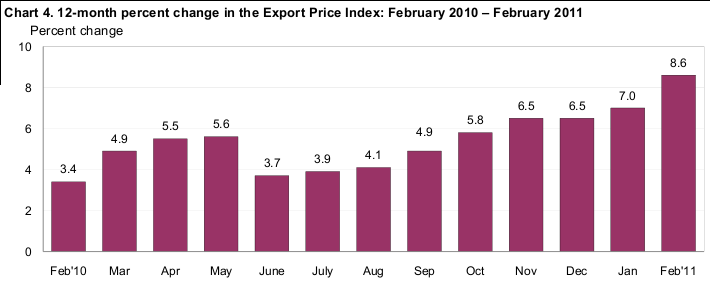
Chart 4. 12-month percent change in the Export Price Index: February 2010 – February 2011
Percent change
All Exports: Export prices rose 1.2 percent in January following a 1.3 percent advance the previous month.
The index has risen at least 0.6 percent every month since a 0.2 percent decline in July 2010. The price
index for overall exports increased 8.6 percent over the past year, the largest 12-month advance since a 10.2
percent rise for the year ended in July 2008.Agricultural Exports: Agricultural exports advanced 4.4 percent in February and 33.5 percent over the past
12 months. The price index for agricultural exports is at the highest level since the index was first published
in March 1985, and the year-over-year increase in February was the largest since a 39.7 percent surge for
the July 2007-08 period. Rising cotton prices, up 15.7 percent in February and 153.5 percent over the past
year, had the largest contribution to both the February and 12-month advances for agricultural prices. Prices
for corn, wheat, and soybeans, which rose 7.9 percent, 11.0 percent, and 3.4 percent, respectively, in
February, also continued an upward trend.All Exports Excluding Agriculture: Nonagricultural prices increased 0.9 percent in February following a
1.0 percent advance the previous month. Rising prices in February for nonagricultural industrial supplies
and materials prices and consumer goods, up 2.6 percent and 0.5 percent, respectively, more than offset a
0.3 percent drop in capital goods prices. The price index for nonagricultural exports increased 6.2 percent
for the year ended in February.Import Prices
Nonfuel Industrial Supplies and Materials: The price index for nonfuel industrial supplies and materials
rose 1.3 percent in February following a 2.1 percent rise the previous month. Higher prices for metals and
chemicals drove the increases in each month. Unfinished metal prices advanced 1.8 percent in February,
while chemical prices rose 1.2 percent.Finished Goods: Prices for each of the major finished goods categories advanced in February. Consumer
goods prices increased 0.2 percent in February, led by a 0.9 percent increase in the price index for cotton
apparel and household goods. The price index for capital goods also rose 0.2 percent as higher prices for
both computers, peripherals and semiconductors, and capital goods excluding computers contributed to the
advance. Prices for automotive vehicles ticked up 0.1 percent in February after rising 0.3 percent in January.
Foods, Feeds, and Beverages: Foods, feeds, and beverages prices rose 0.8 percent in February following a
2.5 percent increase the previous month. In February, rising prices for meat, food oils, fruit, and coffee, up
7.2 percent, 5.6 percent, 2.9 percent, and 3.9 percent, respectively, more than offset a 6.4 percent drop in
vegetable prices and a 3.9 percent decline in the price index for bakery and confectionery products.Imports by Locality of Origin: Prices for imports from China continued to rise in January, increasing 0.4
percent for the second consecutive month. Import prices from China have risen 2.0 percent over the past
year, the largest 12-month advance since a 2.8 percent increase for the December 2007-08 period. Prices for
imports from Japan advanced 0.5 percent for the second consecutive month and rose 3.1 percent for the year
ended in February, the largest 12-month increase for the index since a 3.3 percent advance in November
1995.Transportation Services: Import air passenger fares fell 2.4 percent in February after a similar 2.6 percent
drop the previous month. Lower Asian and European fares contributed to the February decline. Import air
freight prices advanced 1.7 percent in February, following a 1.6 percent decrease in January.Export Prices
Nonagricultural Industrial Supplies and Materials: Prices for nonagricultural industrial supplies and
materials advanced 2.6 percent in February after a similar 2.5 percent increase the previous month. The rise
was driven by a 3.5 percent advance in fuel prices, a 2.4 percent increase in chemicals prices, and a 15.4
percent jump in steelmaking and ferroalloying material prices.Finished Goods: Finished goods prices were mixed in February. Capital goods prices fell 0.3 percent,
driven by a 1.5 percent drop in the price index for computers, peripherals, and semiconductors. In contrast,
consumer goods prices rose 0.5 percent in February, while prices for automotive vehicles were unchanged.Transportation Services: Export air passenger fares fell 6.0 percent in February, the largest monthly
decline since an 8.6 percent drop in September. The February decrease was driven by a 16.8 percent drop in
Asian fares. The price index for export air freight rose 1.5 percent in February and 3.8 percent the previous
month.Import and Export Price Index data for March 2011 are scheduled for release on Tuesday, April 12,
2011 at 8:30 a.m. (EDT).

| Attachment | Size |
|---|---|
| FebBLSChart1.jpg [3] | 15.68 KB |
| BLSFebImportExportPrices.pdf [4] | 204.48 KB |
| FebBLSChart2.jpg [5] | 16.6 KB |
| BLSFebTableA.jpg [6] | 81.49 KB |
| BLSFebChart3.jpg [7] | 16.48 KB |
| BLSFebChart4.jpg [8] | 17 KB |
| 800px-The_Garden_of_Earthly_Delights_by_Bosch_High_Resolution.jpg [9] | 128.44 KB |
| JapanMarketClose.jpg [10] | 10.83 KB |